The price of silver, represented by #XAGUSD, has increased for two consecutive days. However, the current conditions suggest that caution is necessary for those who are optimistic about its future performance.
…
This is a premium post.
[s2If !current_user_can(access_s2member_level4)]Please register for FREE REGISTER to read full post below containing analysis. In case of any error or you think you are not able to read the full post below, please email us at support#nehcap.com [lwa][/s2If] [s2If current_user_can(access_s2member_level1)]
- Silver gains positive traction for the second straight day, though the setup warrants caution for bulls.
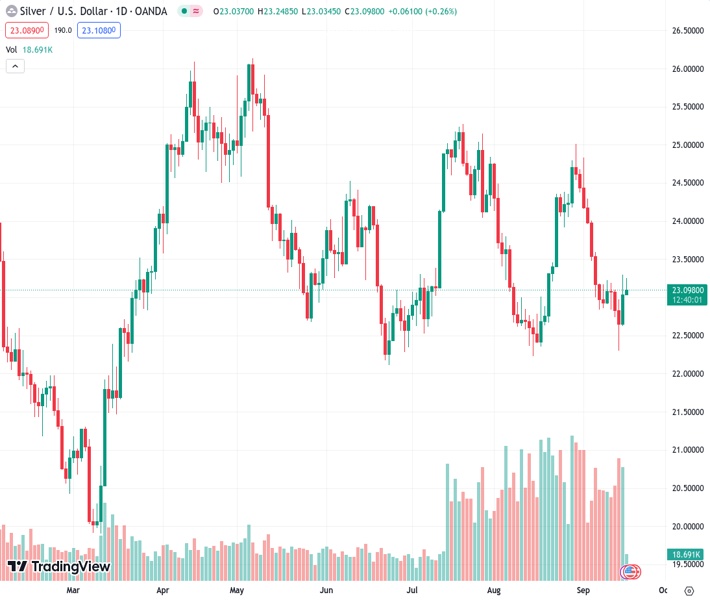
The pair currently trades last at 23.102.
The previous day high was 23.29 while the previous day low was 22.63. The daily 38.2% Fib levels comes at 23.04, expected to provide support. Similarly, the daily 61.8% fib level is at 22.88, expected to provide support.
Silver attracts fresh buyers near the $23.00 mark on the first day of a new week and sticks to its modest intraday gains through the early part of the European session. The white metal currently trades around the $23.15 area, up 0.45% for the day, though remains below Friday’s swing high.
Looking at the broader picture, the XAG/USD last week staged a solid recovery from the $22.30 support area – representing an ascending trend line extending from the June monthly low. The subsequent strength favours bullish traders, though technical indicators on the daily chart are yet to confirm a positive outlook and warrant some caution before positioning for additional gains.
Hence, any further move up is more likely to confront stiff resistance and remain capped near a technically significant 200-day Simple Moving Average (SMA), currently pegged around the $23.45 region. The said area should act as a pivotal point, above which the XAG/USD is more likely to surpass the 100-day SMA barrier near the $23.80 region and aim to reclaim the $24.00 mark.
The next relevant hurdle is pegged near the $24.30-$24.35 region, which if cleared decisively should lift the XAG/USD further towards the $25.00 psychological mark. The latter coincides with the August monthly swing high and some follow-through buying, leading to subsequent gains beyond the July peak, around the $25.25 region, will shift the near-term bias in favour of bullish traders.
On the flip side, the $22.80 area now seems to protect the immediate downside ahead of the $23.30 region, or a nearly one-month low touched last Thursday. A convincing break below will confirm a fresh breakdown and make the XAG/USD vulnerable to accelerate the fall towards the next relevant support near the $21.25 zone before eventually dropping to the $21.00 round-figure mark.
Technical Levels: Supports and Resistances
XAGUSD currently trading at 23.13 at the time of writing. Pair opened at 23.04 and is trading with a change of 0.39 % .
| Overview | Overview.1 | |
|---|---|---|
| 0 | Today last price | 23.13 |
| 1 | Today Daily Change | 0.09 |
| 2 | Today Daily Change % | 0.39 |
| 3 | Today daily open | 23.04 |
The pair remains strongly bearish on the daily time frame. It trades below the 20 SMA @ 23.64, 50 SMA 23.74, 100 SMA @ 23.74 and 200 SMA @ 23.48.
| Trends | Trends.1 | |
|---|---|---|
| 0 | Daily SMA20 | 23.64 |
| 1 | Daily SMA50 | 23.74 |
| 2 | Daily SMA100 | 23.74 |
| 3 | Daily SMA200 | 23.48 |
The previous day high was 23.29 while the previous day low was 22.63. The daily 38.2% Fib levels comes at 23.04, expected to provide support. Similarly, the daily 61.8% fib level is at 22.88, expected to provide support.
Note the levels of interest below:
- Pivot support is noted at 22.68, 22.32, 22.01
- Pivot resistance is noted at 23.35, 23.65, 24.02
| Levels | Levels.1 |
|---|---|
| Previous Daily High | 23.29 |
| Previous Daily Low | 22.63 |
| Previous Weekly High | 23.29 |
| Previous Weekly Low | 22.30 |
| Previous Monthly High | 25.02 |
| Previous Monthly Low | 22.23 |
| Daily Fibonacci 38.2% | 23.04 |
| Daily Fibonacci 61.8% | 22.88 |
| Daily Pivot Point S1 | 22.68 |
| Daily Pivot Point S2 | 22.32 |
| Daily Pivot Point S3 | 22.01 |
| Daily Pivot Point R1 | 23.35 |
| Daily Pivot Point R2 | 23.65 |
| Daily Pivot Point R3 | 24.02 |
[/s2If]
Download Nehcap EAWe have two EAs that are operational on our LIVE accounts.
- EA-FIX: Check out the details here. Download EA-FIX . EA-FIX is a non-grid HFT scalper.
- EA-GROWTH: High quality low dd EA using trend grids. Download EA_GROWTHJoin Our Telegram Group
")


