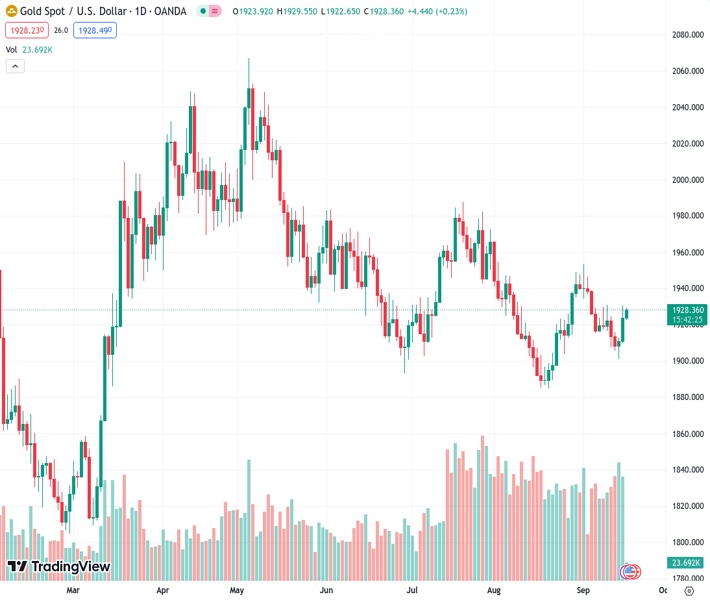
The price of Gold, represented by #XAUUSD at 1,928.16, experiences a rise for the third consecutive day on Monday due to a combination of various factors.
…
This is a premium post.
[s2If !current_user_can(access_s2member_level4)]Please register for FREE REGISTER to read full post below containing analysis. In case of any error or you think you are not able to read the full post below, please email us at support#nehcap.com [lwa][/s2If] [s2If current_user_can(access_s2member_level1)]
- A combination of factors lifts the Gold price higher for the third successive day on Monday.
The pair currently trades last at 1928.16.
The previous day high was 1930.47 while the previous day low was 1909.83. The daily 38.2% Fib levels comes at 1922.59, expected to provide support. Similarly, the daily 61.8% fib level is at 1917.71, expected to provide support.
Gold price attracts some buying for the third successive day on Monday and steadily climbs back closer to the $1,930 supply zone during the Asian session. The XAU/USD might now be looking to build on its recent goodish rebound from the $1,900 round figure, or over a three-week low touched last Thursday and draws support from a generally weaker tone around the Asian equity markets.
Investors remain concerned about the worsening economic conditions in China and the fears were further fueled by the latest developments surrounding China Evergrande Group. The embattled developer delayed a decision to restructure its debt and some of its employees from the wealth management unit were detained in Shenzhen. This comes on the back of China’s conservative approach to introduce more stimulus measures and takes its toll on the global risk sentiment, which, in turn, is seen driving some haven flows towards the Gold price.
Apart from this, a mildly softer tone surrounding the US Dollar (USD) is seen as another factor lending support to the XAU/USD. The downside for the USD, meanwhile, remains cushioned as traders seem reluctant to place aggressive bets ahead of the crucial two-day Federal Open Market Committee (FOMC) policy meeting starting on Tuesday. The Federal Reserve (Fed) is widely anticipated to leave interest rates unchanged, though the markets are still pricing in the possibility of one more 25 basis points (bps) lift-off in November or December.
The outlook remains supportive of elevated US Treasury bond yields, which act as a tailwind for the USD and might keep a lid on any further gains for the non-yielding Gold price. Traders might also refrain from placing aggressive bets and prefer to wait for fresh cues about the Fed’s future rate-hike path. Hence, the focus will be on the accompanying monetary policy statement and Fed Chair Jerome Powell’s remarks at the post-meeting press conference. This will influence the USD and provide a fresh directional impetus to the US Dollar-denominated commodity.
Investors this week will also confront a string of major central bank rate decisions – including the Swiss National Bank (SNB) and the Bank of England (BoE) on Thursday, followed by the Bank of Japan (BoJ) on Friday. Apart from this, the latest consumer inflation figures from Canada and the United Kingdom (UK) on Tuesday and Wednesday, respectively, will be looked upon for some meaningful trading opportunities around the Gold price.
Technical Levels: Supports and Resistances
XAUUSD currently trading at 1928.24 at the time of writing. Pair opened at 1924.0 and is trading with a change of 0.22 % .
| Overview | Overview.1 | |
|---|---|---|
| 0 | Today last price | 1928.24 |
| 1 | Today Daily Change | 4.24 |
| 2 | Today Daily Change % | 0.22 |
| 3 | Today daily open | 1924.00 |
The pair is trading above its 20 Daily moving average @ 1920.94, below its 50 Daily moving average @ 1931.83 , below its 100 Daily moving average @ 1946.91 and above its 200 Daily moving average @ 1922.21
| Trends | Trends.1 | |
|---|---|---|
| 0 | Daily SMA20 | 1920.94 |
| 1 | Daily SMA50 | 1931.83 |
| 2 | Daily SMA100 | 1946.91 |
| 3 | Daily SMA200 | 1922.21 |
The previous day high was 1930.47 while the previous day low was 1909.83. The daily 38.2% Fib levels comes at 1922.59, expected to provide support. Similarly, the daily 61.8% fib level is at 1917.71, expected to provide support.
Note the levels of interest below:
- Pivot support is noted at 1912.4, 1900.79, 1891.76
- Pivot resistance is noted at 1933.04, 1942.07, 1953.68
| Levels | Levels.1 |
|---|---|
| Previous Daily High | 1930.47 |
| Previous Daily Low | 1909.83 |
| Previous Weekly High | 1930.77 |
| Previous Weekly Low | 1901.07 |
| Previous Monthly High | 1966.08 |
| Previous Monthly Low | 1884.85 |
| Daily Fibonacci 38.2% | 1922.59 |
| Daily Fibonacci 61.8% | 1917.71 |
| Daily Pivot Point S1 | 1912.40 |
| Daily Pivot Point S2 | 1900.79 |
| Daily Pivot Point S3 | 1891.76 |
| Daily Pivot Point R1 | 1933.04 |
| Daily Pivot Point R2 | 1942.07 |
| Daily Pivot Point R3 | 1953.68 |
[/s2If]
Download Nehcap EAWe have two EAs that are operational on our LIVE accounts.
- EA-FIX: Check out the details here. Download EA-FIX . EA-FIX is a non-grid HFT scalper.
- EA-GROWTH: High quality low dd EA using trend grids. Download EA_GROWTHJoin Our Telegram Group
")


