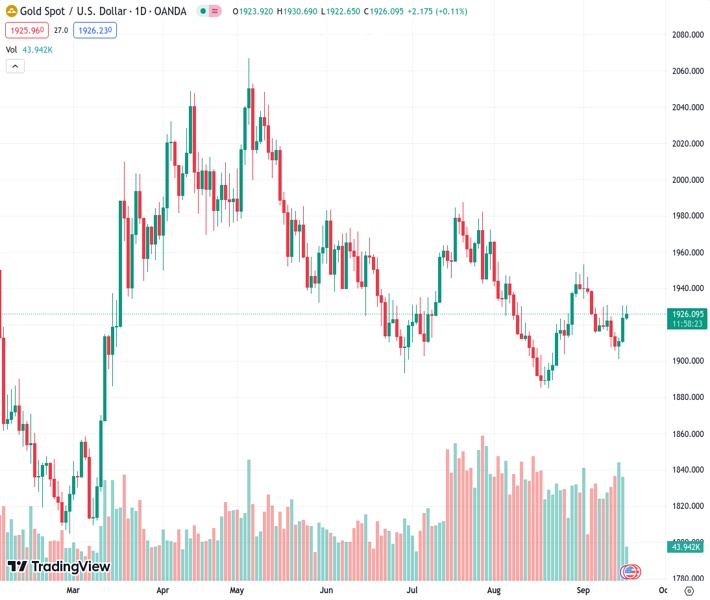
The price of gold, currently at 1,926.03 in the XAUUSD market, has fallen from its one-week high reached earlier this week. However, the decline has not been sustained.
…
This is a premium post.
[s2If !current_user_can(access_s2member_level4)]Please register for FREE REGISTER to read full post below containing analysis. In case of any error or you think you are not able to read the full post below, please email us at support#nehcap.com [lwa][/s2If] [s2If current_user_can(access_s2member_level1)]
- Gold price retreats from a one-week high touched this Monday, albeit lacks follow-through.
The pair currently trades last at 1926.03.
The previous day high was 1930.47 while the previous day low was 1909.83. The daily 38.2% Fib levels comes at 1922.59, expected to provide support. Similarly, the daily 61.8% fib level is at 1917.71, expected to provide support.
Gold price continues with its struggle to make it through the $1,930 resistance zone and pulls back from a one-week high touched earlier this Monday. The XAU/USD, however, manages to hold in the positive territory for the second successive day and trades around the $1,925 region, up just over 0.10% during the first half of the European session.
The US Dollar (USD) remains on the defensive below its highest level in more than six months touched last week and is seen as a key factor lending some support to the Gold price. Apart from this, concerns about a United States (US) government shutdown, along with the worsening property crisis in China, underpin the safe-haven precious metal. In fact, China Evergrande Group delayed a decision to restructure its debt. Furthermore,
some of the employees of the struggling developer’s wealth management unit were detained by police in southern China. This comes on the back of China’s conservative approach to introducing more stimulus measures and tempers investors’ appetite for riskier assets.
The downside for the USD, meanwhile, remains cushioned as traders seem reluctant to place aggressive bets and prefer to wait for the latest monetary policy update by the Federal Reserve (Fed). This, in turn, keeps a lid on any meaningful appreciating move for the US Dollar-denominated Gold price. The Fed is scheduled to announce the outcome of a two-day monetary policy meeting on Wednesday and is widely anticipated to maintain the status quo. The markets, however, are still pricing in the possibility of one more 25 basis points (bps) lift-off by the end of this year, either in November or December. Hence, the market focus will remain glued to the accompanying monetary policy statement.
Apart from this, investors will closely scrutinize Fed Chair Jerome Powell’s comments at the post-meeting press conference for fresh cues about the future rate-hike path. This, in turn, will play a key role in influencing the near-term USD price dynamics and provide a fresh impetus to the Gold price. Market participants this week will also confront a string of rate decisions by other major central banks – the Swiss National Bank (SNB) and the Bank of England (BoE) on Thursday, followed by the Bank of Japan (BoJ) on Friday. Apart from this, the latest consumer inflation figures from Canada and the United Kingdom (UK) on Tuesday and Wednesday, respectively, might contribute to producing trading opportunities around the XAU/USD.
Technical Levels: Supports and Resistances
XAUUSD currently trading at 1925.34 at the time of writing. Pair opened at 1924.0 and is trading with a change of 0.07 % .
| Overview | Overview.1 | |
|---|---|---|
| 0 | Today last price | 1925.34 |
| 1 | Today Daily Change | 1.34 |
| 2 | Today Daily Change % | 0.07 |
| 3 | Today daily open | 1924.00 |
The pair is trading above its 20 Daily moving average @ 1920.94, below its 50 Daily moving average @ 1931.83 , below its 100 Daily moving average @ 1946.91 and above its 200 Daily moving average @ 1922.21
| Trends | Trends.1 | |
|---|---|---|
| 0 | Daily SMA20 | 1920.94 |
| 1 | Daily SMA50 | 1931.83 |
| 2 | Daily SMA100 | 1946.91 |
| 3 | Daily SMA200 | 1922.21 |
The previous day high was 1930.47 while the previous day low was 1909.83. The daily 38.2% Fib levels comes at 1922.59, expected to provide support. Similarly, the daily 61.8% fib level is at 1917.71, expected to provide support.
Note the levels of interest below:
- Pivot support is noted at 1912.4, 1900.79, 1891.76
- Pivot resistance is noted at 1933.04, 1942.07, 1953.68
| Levels | Levels.1 |
|---|---|
| Previous Daily High | 1930.47 |
| Previous Daily Low | 1909.83 |
| Previous Weekly High | 1930.77 |
| Previous Weekly Low | 1901.07 |
| Previous Monthly High | 1966.08 |
| Previous Monthly Low | 1884.85 |
| Daily Fibonacci 38.2% | 1922.59 |
| Daily Fibonacci 61.8% | 1917.71 |
| Daily Pivot Point S1 | 1912.40 |
| Daily Pivot Point S2 | 1900.79 |
| Daily Pivot Point S3 | 1891.76 |
| Daily Pivot Point R1 | 1933.04 |
| Daily Pivot Point R2 | 1942.07 |
| Daily Pivot Point R3 | 1953.68 |
[/s2If]
Download Nehcap EAWe have two EAs that are operational on our LIVE accounts.
- EA-FIX: Check out the details here. Download EA-FIX . EA-FIX is a non-grid HFT scalper.
- EA-GROWTH: High quality low dd EA using trend grids. Download EA_GROWTHJoin Our Telegram Group
")


