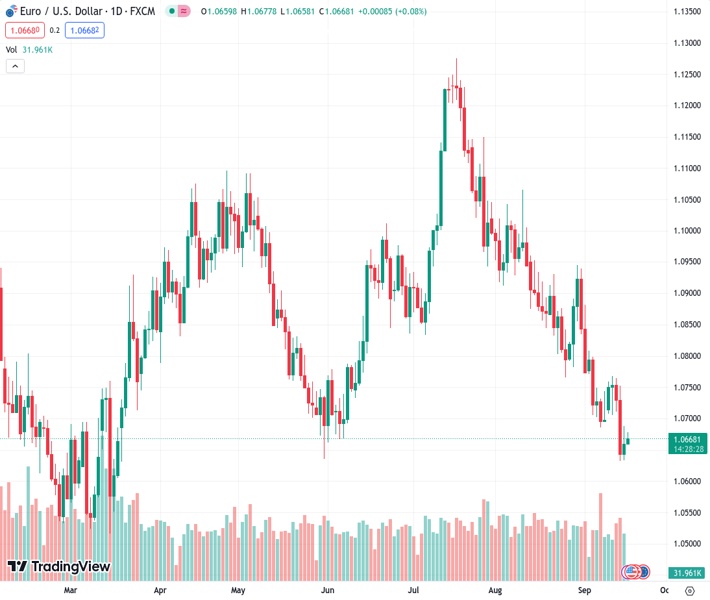
The EURUSD pair is currently trading at 1.0673, maintaining its position and experiencing a 0.16% increase throughout the day.
…
This is a premium post.
[s2If !current_user_can(access_s2member_level4)]Please register for FREE REGISTER to read full post below containing analysis. In case of any error or you think you are not able to read the full post below, please email us at support#nehcap.com [lwa][/s2If] [s2If current_user_can(access_s2member_level1)]
- EUR/USD holds ground around 1.0673, gaining 0.16% on the day.
The pair currently trades last at 1.06700.
The previous day high was 1.0688 while the previous day low was 1.0633. The daily 38.2% Fib levels comes at 1.0667, expected to provide support. Similarly, the daily 61.8% fib level is at 1.0654, expected to provide support.
The EUR/USD pair recovers from the recent losses and trades near 1.0675 during the early European trading hours on Monday. The upside of the major seems limited as investors await the Federal Reserve (Fed) interest rate decision on Wednesday.
The key US data indicated healthy economic conditions over the last week, which could support one more rate hike by the end of 2023. However, markets have priced in that the Fed would skip hiking rates in September, while odds for a 25 basis point (bps) hike at the November meeting decline to 27%, according to the CME Fedwatch tool.
According to the four-hour chart, the EUR/USD pair holds below the 50- and 100-day Exponential Moving Averages (EMAs), implying the path of least resistance for the EUR/USD is to the downside. Adding to this, the Relative Strength Index (RSI) remains in the bearish territory below 50, supporting EUR/USD sellers for now.
The immediate resistance level for EUR/USD appears at 1.0712 (the 50-hour EMA). Further north, the pair will challenge the next hurdle at 1.0755 (the 100-hour EMA). Any meaningful follow-through buying beyond the latter could pave the way to the next barrier near the upper boundary of the Bollinger Band at 1.0768 en route to a psychological round mark at 1.0800.
On the downside, the key support level to watch is 1.0610, representing the lower limit of the Bollinger Band. The additional downside stop is seen at 1.0538 (a low of February 27), followed by 1.0515 (a low of March 15).
Technical Levels: Supports and Resistances
EURUSD currently trading at 1.0676 at the time of writing. Pair opened at 1.0657 and is trading with a change of 0.18 % .
| Overview | Overview.1 | |
|---|---|---|
| 0 | Today last price | 1.0676 |
| 1 | Today Daily Change | 0.0019 |
| 2 | Today Daily Change % | 0.1800 |
| 3 | Today daily open | 1.0657 |
The pair remains strongly bearish on the daily time frame. It trades below the 20 SMA @ 1.0782, 50 SMA 1.093, 100 SMA @ 1.0895 and 200 SMA @ 1.0828.
| Trends | Trends.1 | |
|---|---|---|
| 0 | Daily SMA20 | 1.0782 |
| 1 | Daily SMA50 | 1.0930 |
| 2 | Daily SMA100 | 1.0895 |
| 3 | Daily SMA200 | 1.0828 |
The previous day high was 1.0688 while the previous day low was 1.0633. The daily 38.2% Fib levels comes at 1.0667, expected to provide support. Similarly, the daily 61.8% fib level is at 1.0654, expected to provide support.
Note the levels of interest below:
- Pivot support is noted at 1.0631, 1.0605, 1.0576
- Pivot resistance is noted at 1.0686, 1.0714, 1.074
| Levels | Levels.1 |
|---|---|
| Previous Daily High | 1.0688 |
| Previous Daily Low | 1.0633 |
| Previous Weekly High | 1.0769 |
| Previous Weekly Low | 1.0632 |
| Previous Monthly High | 1.1065 |
| Previous Monthly Low | 1.0766 |
| Daily Fibonacci 38.2% | 1.0667 |
| Daily Fibonacci 61.8% | 1.0654 |
| Daily Pivot Point S1 | 1.0631 |
| Daily Pivot Point S2 | 1.0605 |
| Daily Pivot Point S3 | 1.0576 |
| Daily Pivot Point R1 | 1.0686 |
| Daily Pivot Point R2 | 1.0714 |
| Daily Pivot Point R3 | 1.0740 |
[/s2If]
Download Nehcap EAWe have two EAs that are operational on our LIVE accounts.
- EA-FIX: Check out the details here. Download EA-FIX . EA-FIX is a non-grid HFT scalper.
- EA-GROWTH: High quality low dd EA using trend grids. Download EA_GROWTHJoin Our Telegram Group
")


