The EURUSD is trying to make a recovery and reach the 1.0700 level before the Federal Reserve’s presentation later this week.
…
This is a premium post.
[s2If !current_user_can(access_s2member_level4)]Please register for FREE REGISTER to read full post below containing analysis. In case of any error or you think you are not able to read the full post below, please email us at support#nehcap.com [lwa][/s2If] [s2If current_user_can(access_s2member_level1)]
- The EUR/USD is hunting for an upshot to reclaim the 1.0700 handle ahead of a midweek Fed showing.
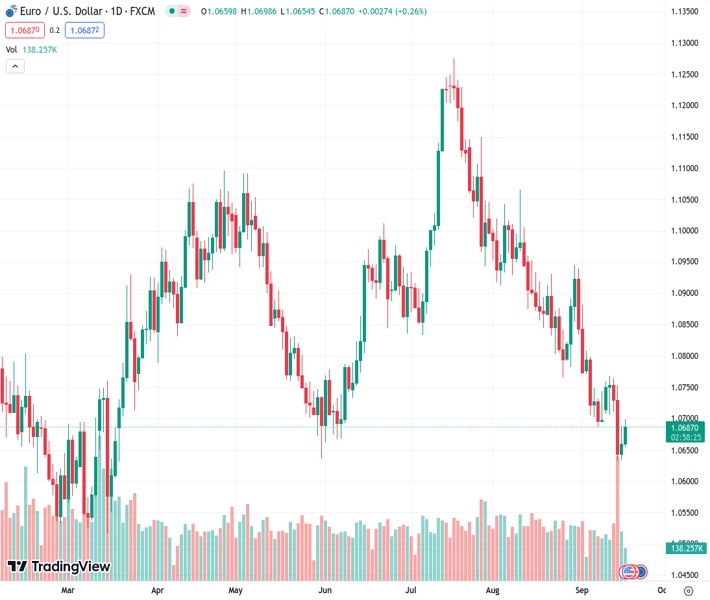
The pair currently trades last at 1.06876.
The previous day high was 1.0688 while the previous day low was 1.0633. The daily 38.2% Fib levels comes at 1.0667, expected to provide support. Similarly, the daily 61.8% fib level is at 1.0654, expected to provide support.
The EUR/USD is shifting higher to kick off the new trading week, claiming ground that was recently lost in last week’s backslide.
The Euro (EUR) has managed to turn Monday into the green against the Greenback (USD) after opening the day near 1.0668, and the pair is currently tapping into the ceiling near 1.0700.
It’s going to be a Dollar-dominant week for the EUR/USD with the economic calendar notably thin for the European Union (EU) side of the equation, and the Federal Reserve (Fed) slated for another rate call in the midweek.
The Fed is largely expected to stand pat on interest rates at 5.5%, but investors will be keeping a close eye on the Fed’s ‘dot plot’ and inflation expectations, as well as looking for any forward-looking indications during the Federal Open Market Committee (FOMC) press conference. The Fed’s rate call drops at 18:00 GMT on Wednesday, with the press conference slated for half an hour later at 18:30.
US Initial Jobless Claims for the week into September 15th land on Thursday at 12:30 GMT, followed by preliminary Consumer Confidence figures at 14:00. US jobless claims last printed at 220K, while EU consumer sentiment is expected to decline slightly from -16 to -16.5.
Both releases are expected to be medium impact and market participants will largely be focused on Friday’s Purchasing Manager Indexes (PMI) for both the EU and the US.
The EU’s Composite PMI, scheduled early Friday at 08:00 GMT is expected to decline slightly from 46.7 to 46.3, while the US side sees similar expectations at 13:45 GMT. The US Manufacturing PMI is forecast to slide from 47.9 to 47.8, while the services component is expected to tick down to 50.3 from 50.5.
Euro bulls will be looking to mark in a green week after the EUR/USD pair has closed bearish for the past nine consecutive weeks, and daily candlesticks have the pair firmly on the downside.
The 200-day Simple Moving Average (SMA) sits above current prices, parked near 1.0830, and the 34-day Exponential Moving Average (EMA) has given a bearish cross, gaining downside momentum into 1.0800.
Both the Relative Strength Index (RSI) and the Moving Average Convergence-Divergence (MCAD) indicator are on the low end, implying oversold conditions, and it’s the bulls’ game to lose if the Federal Reserve gives any surprises that could send the USD higher.
Technical Levels: Supports and Resistances
EURUSD currently trading at 1.0694 at the time of writing. Pair opened at 1.0657 and is trading with a change of 0.35 % .
| Overview | Overview.1 | |
|---|---|---|
| 0 | Today last price | 1.0694 |
| 1 | Today Daily Change | 0.0037 |
| 2 | Today Daily Change % | 0.3500 |
| 3 | Today daily open | 1.0657 |
The pair remains strongly bearish on the daily time frame. It trades below the 20 SMA @ 1.0782, 50 SMA 1.093, 100 SMA @ 1.0895 and 200 SMA @ 1.0828.
| Trends | Trends.1 | |
|---|---|---|
| 0 | Daily SMA20 | 1.0782 |
| 1 | Daily SMA50 | 1.0930 |
| 2 | Daily SMA100 | 1.0895 |
| 3 | Daily SMA200 | 1.0828 |
The previous day high was 1.0688 while the previous day low was 1.0633. The daily 38.2% Fib levels comes at 1.0667, expected to provide support. Similarly, the daily 61.8% fib level is at 1.0654, expected to provide support.
Note the levels of interest below:
- Pivot support is noted at 1.0631, 1.0605, 1.0576
- Pivot resistance is noted at 1.0686, 1.0714, 1.074
| Levels | Levels.1 |
|---|---|
| Previous Daily High | 1.0688 |
| Previous Daily Low | 1.0633 |
| Previous Weekly High | 1.0769 |
| Previous Weekly Low | 1.0632 |
| Previous Monthly High | 1.1065 |
| Previous Monthly Low | 1.0766 |
| Daily Fibonacci 38.2% | 1.0667 |
| Daily Fibonacci 61.8% | 1.0654 |
| Daily Pivot Point S1 | 1.0631 |
| Daily Pivot Point S2 | 1.0605 |
| Daily Pivot Point S3 | 1.0576 |
| Daily Pivot Point R1 | 1.0686 |
| Daily Pivot Point R2 | 1.0714 |
| Daily Pivot Point R3 | 1.0740 |
[/s2If]
Download Nehcap EAWe have two EAs that are operational on our LIVE accounts.
- EA-FIX: Check out the details here. Download EA-FIX . EA-FIX is a non-grid HFT scalper.
- EA-GROWTH: High quality low dd EA using trend grids. Download EA_GROWTHJoin Our Telegram Group
")


