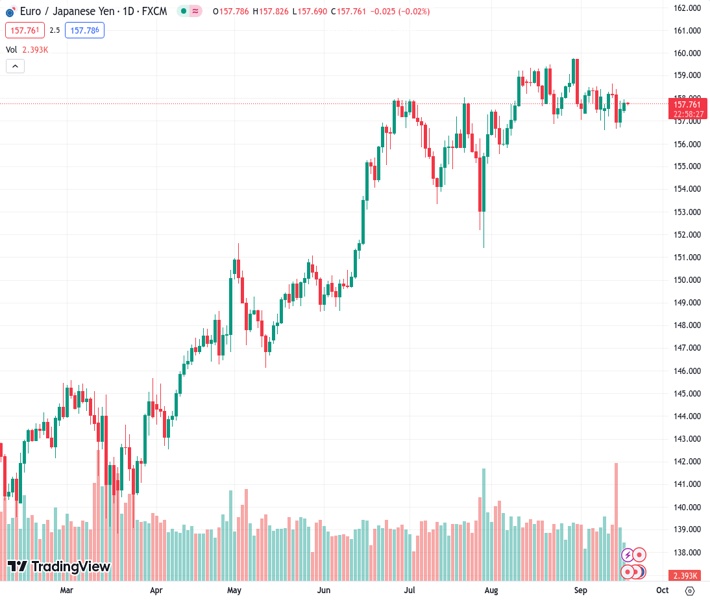
The EURJPY pair, currently trading at 157.817, made progress close to the 158.00 level, marking another day of consecutive increases.
…
This is a premium post.
[s2If !current_user_can(access_s2member_level4)]Please register for FREE REGISTER to read full post below containing analysis. In case of any error or you think you are not able to read the full post below, please email us at support#nehcap.com [lwa][/s2If] [s2If current_user_can(access_s2member_level1)]
- EUR/JPY advanced near 158.00, setting a consecutive day of gains.
The pair currently trades last at 157.817.
The previous day high was 157.9 while the previous day low was 156.72. The daily 38.2% Fib levels comes at 157.45, expected to provide support. Similarly, the daily 61.8% fib level is at 157.17, expected to provide support.
On Monday, the EUR/JPY cross slightly advanced, near the 157.80 zone. Still, the pair could see further consolidation if the bull fails to reclaim the 20-day Simple Moving Average (SMA) at 158.00.
In line with that, indicators on the daily chart exhibit signs of bullish exhaustion, contributing to a neutral to bearish technical perspective. The Relative Strength Index (RSI), despite seeing a positive slope above its midline, displays a clear downward trend since mid-August, while the Moving Average Convergence (MACD) shows neutral red bars. Additionally, the pair is below the 20-day Simple Moving Average (SMA) but above the 100 and 200-day SMAs, indicating that the bulls still have the upper hand when looking at the broader picture. However, the pair got rejected by the 20-day SMA at 158.00 during September, which contributed to the pair losing momentum and left the door open for further downside.
Support levels: 157.00, 155.00, 154.60 (100-day SMA)
Resistance levels: 158.00 (20-day SMA), 158.50, 159.00.
Technical Levels: Supports and Resistances
EURJPY currently trading at 157.8 at the time of writing. Pair opened at 157.58 and is trading with a change of 0.14 % .
| Overview | Overview.1 | |
|---|---|---|
| 0 | Today last price | 157.80 |
| 1 | Today Daily Change | 0.22 |
| 2 | Today Daily Change % | 0.14 |
| 3 | Today daily open | 157.58 |
The pair is trading below its 20 Daily moving average @ 158.11, above its 50 Daily moving average @ 157.22 , above its 100 Daily moving average @ 154.49 and above its 200 Daily moving average @ 148.75
| Trends | Trends.1 | |
|---|---|---|
| 0 | Daily SMA20 | 158.11 |
| 1 | Daily SMA50 | 157.22 |
| 2 | Daily SMA100 | 154.49 |
| 3 | Daily SMA200 | 148.75 |
The previous day high was 157.9 while the previous day low was 156.72. The daily 38.2% Fib levels comes at 157.45, expected to provide support. Similarly, the daily 61.8% fib level is at 157.17, expected to provide support.
Note the levels of interest below:
- Pivot support is noted at 156.9, 156.22, 155.73
- Pivot resistance is noted at 158.08, 158.58, 159.26
| Levels | Levels.1 |
|---|---|
| Previous Daily High | 157.90 |
| Previous Daily Low | 156.72 |
| Previous Weekly High | 158.66 |
| Previous Weekly Low | 156.58 |
| Previous Monthly High | 159.76 |
| Previous Monthly Low | 155.53 |
| Daily Fibonacci 38.2% | 157.45 |
| Daily Fibonacci 61.8% | 157.17 |
| Daily Pivot Point S1 | 156.90 |
| Daily Pivot Point S2 | 156.22 |
| Daily Pivot Point S3 | 155.73 |
| Daily Pivot Point R1 | 158.08 |
| Daily Pivot Point R2 | 158.58 |
| Daily Pivot Point R3 | 159.26 |
[/s2If]
Download Nehcap EAWe have two EAs that are operational on our LIVE accounts.
- EA-FIX: Check out the details here. Download EA-FIX . EA-FIX is a non-grid HFT scalper.
- EA-GROWTH: High quality low dd EA using trend grids. Download EA_GROWTHJoin Our Telegram Group
")


