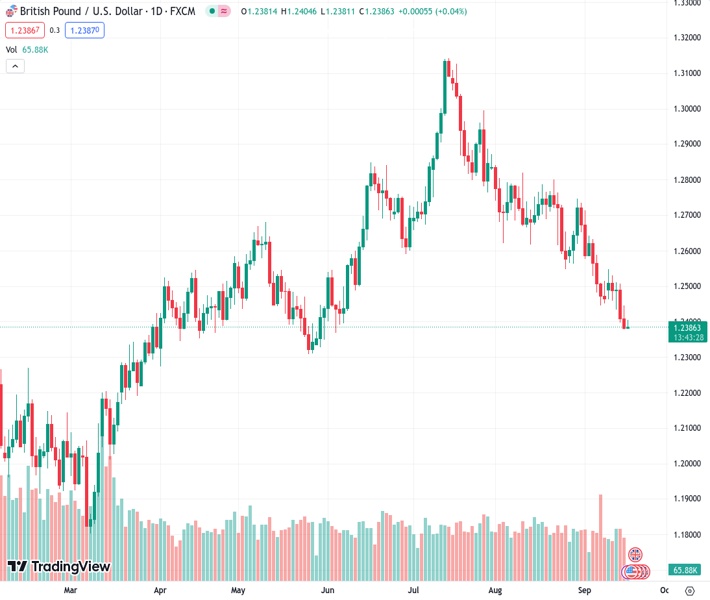
The currency pair GBPUSD, currently at 1.23872, is still seeing an upward trend, although it has encountered a downturn below the 1.2400 level.
…
This is a premium post.
[s2If !current_user_can(access_s2member_level4)]Please register for FREE REGISTER to read full post below containing analysis. In case of any error or you think you are not able to read the full post below, please email us at support#nehcap.com [lwa][/s2If] [s2If current_user_can(access_s2member_level1)]
- GBP/USD continues to trade higher but has experienced a reversal below 1.2400.
The pair currently trades last at 1.23872.
The previous day high was 1.2446 while the previous day low was 1.2379. The daily 38.2% Fib levels comes at 1.2405, expected to provide resistance. Similarly, the daily 61.8% fib level is at 1.242, expected to provide resistance.
GBP/USD snaps the two-day losing streak earlier in the day but later reverses, still trading higher around 1.2390 during the early trading hours of the European session on Monday. The pair experienced upward support, likely a result of the downbeat consumer sentiment data from the United States (US) released on Friday.
The preliminary US Michigan Consumer Sentiment Index recorded a reading of 67.7, indicating a decline from the previous figure of 69.5. This reading also fell below the expected figure of 69.1 for the month of September.
Investors are expecting the Bank of England (BoE) to raise interest rates by 25 basis points in the upcoming meeting on Thursday. On the other side, the US Federal Reserve (Fed) is expected to maintain its current interest rate on Wednesday.
The GBP/USD pair could face a challenge around the nine-day Exponential Moving Average (EMA) at 1.2463, followed by the 12-day EMA at 1.2488 level.
A firm break above the 1.2500 psychological level could lead the pair to explore the region around 23.6% Fibonacci retracement at 1.2560.
On the flip side, immediate support for the GBP/USD pair appears around June’s lows at 1.2368, followed by the 1.2350 psychological level.
If bearish sentiment exerts pressure, the currency pair could potentially approach the next support level near the lows seen in May at 1.2308, followed by the 1.2300 psychological level.
The Moving Average Convergence Divergence (MACD) line remains below the centerline and shows divergence below the signal line. This configuration suggests a potential bearish momentum in the market, which can be seen as a signal that the recent downward trend may continue to exist.
Traders of the GBP/USD pair will likely observe the 14-day Relative Strength Index (RSI), which indicates bearish momentum in the short term as it lies below the 50 level.
Technical Levels: Supports and Resistances
GBPUSD currently trading at 1.2388 at the time of writing. Pair opened at 1.2383 and is trading with a change of 0.04 % .
| Overview | Overview.1 | |
|---|---|---|
| 0 | Today last price | 1.2388 |
| 1 | Today Daily Change | 0.0005 |
| 2 | Today Daily Change % | 0.0400 |
| 3 | Today daily open | 1.2383 |
The pair remains strongly bearish on the daily time frame. It trades below the 20 SMA @ 1.2577, 50 SMA 1.2733, 100 SMA @ 1.2654 and 200 SMA @ 1.2433.
| Trends | Trends.1 | |
|---|---|---|
| 0 | Daily SMA20 | 1.2577 |
| 1 | Daily SMA50 | 1.2733 |
| 2 | Daily SMA100 | 1.2654 |
| 3 | Daily SMA200 | 1.2433 |
The previous day high was 1.2446 while the previous day low was 1.2379. The daily 38.2% Fib levels comes at 1.2405, expected to provide resistance. Similarly, the daily 61.8% fib level is at 1.242, expected to provide resistance.
Note the levels of interest below:
- Pivot support is noted at 1.2359, 1.2336, 1.2292
- Pivot resistance is noted at 1.2426, 1.247, 1.2494
| Levels | Levels.1 |
|---|---|
| Previous Daily High | 1.2446 |
| Previous Daily Low | 1.2379 |
| Previous Weekly High | 1.2548 |
| Previous Weekly Low | 1.2379 |
| Previous Monthly High | 1.2841 |
| Previous Monthly Low | 1.2548 |
| Daily Fibonacci 38.2% | 1.2405 |
| Daily Fibonacci 61.8% | 1.2420 |
| Daily Pivot Point S1 | 1.2359 |
| Daily Pivot Point S2 | 1.2336 |
| Daily Pivot Point S3 | 1.2292 |
| Daily Pivot Point R1 | 1.2426 |
| Daily Pivot Point R2 | 1.2470 |
| Daily Pivot Point R3 | 1.2494 |
[/s2If]
Download Nehcap EAWe have two EAs that are operational on our LIVE accounts.
- EA-FIX: Check out the details here. Download EA-FIX . EA-FIX is a non-grid HFT scalper.
- EA-GROWTH: High quality low dd EA using trend grids. Download EA_GROWTHJoin Our Telegram Group
")


