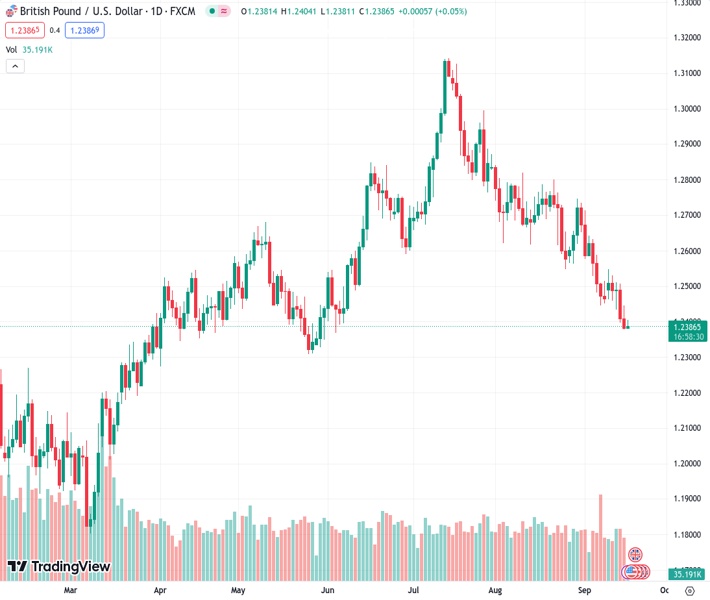
On Monday, the GBPUSD pair is experiencing downward pressure and is near a three-month low of approximately 1.2390.
…
This is a premium post.
[s2If !current_user_can(access_s2member_level4)]Please register for FREE REGISTER to read full post below containing analysis. In case of any error or you think you are not able to read the full post below, please email us at support#nehcap.com [lwa][/s2If] [s2If current_user_can(access_s2member_level1)]
- GBP/USD remains under pressure near a three-month low of around 1.2390 on Monday.
The pair currently trades last at 1.23877.
The previous day high was 1.2446 while the previous day low was 1.2379. The daily 38.2% Fib levels comes at 1.2405, expected to provide resistance. Similarly, the daily 61.8% fib level is at 1.242, expected to provide resistance.
The GBP/USD pair remains on the defensive below the 1.2400 mark during the early Asian trading hours on Monday. The major pair currently trades near 1.2390, up 0.06% on the day. Market players prefer to wait on the sidelines ahead of the key event from this week. On Wednesday, the Federal Reserve (Fed) interest rate decision and the UK Consumer Price Index for August will be due. These events could trigger the volatility in the pair.
From the technical perspective, GBP/USD holds below the 50- and 100-hour Exponential Moving Averages (EMAs) with a downward slope on the one-hour chart, which means further downside looks favorable. Meanwhile, the Relative Strength Index (RSI) stands below 50, within bearish territory, suggesting that sellers are likely to retain control in the near term.
The key resistance level for GBP/USD is seen near the confluence of the upper boundary of the Bollinger Band and the 50-hour EMA at the 1.2420-1.2430 region. The additional upside filter is located at 1.2445 (the 100-hour EMA). Further north, a psychological round figure at 1.2500 will be the next barrier for the pair, followed by 1.2530 (a high of September 12).
On the downside, any follow-through selling below the lower limit of the Bollinger Band at 1.2367 will see a drop to 1.2350 (a low of May 31). The next contention for the pair emerges near a round mark and a low of May 25 at 1.2300.
Technical Levels: Supports and Resistances
GBPUSD currently trading at 1.2391 at the time of writing. Pair opened at 1.2383 and is trading with a change of 0.06 % .
| Overview | Overview.1 | |
|---|---|---|
| 0 | Today last price | 1.2391 |
| 1 | Today Daily Change | 0.0008 |
| 2 | Today Daily Change % | 0.0600 |
| 3 | Today daily open | 1.2383 |
The pair remains strongly bearish on the daily time frame. It trades below the 20 SMA @ 1.2577, 50 SMA 1.2733, 100 SMA @ 1.2654 and 200 SMA @ 1.2433.
| Trends | Trends.1 | |
|---|---|---|
| 0 | Daily SMA20 | 1.2577 |
| 1 | Daily SMA50 | 1.2733 |
| 2 | Daily SMA100 | 1.2654 |
| 3 | Daily SMA200 | 1.2433 |
The previous day high was 1.2446 while the previous day low was 1.2379. The daily 38.2% Fib levels comes at 1.2405, expected to provide resistance. Similarly, the daily 61.8% fib level is at 1.242, expected to provide resistance.
Note the levels of interest below:
- Pivot support is noted at 1.2359, 1.2336, 1.2292
- Pivot resistance is noted at 1.2426, 1.247, 1.2494
| Levels | Levels.1 |
|---|---|
| Previous Daily High | 1.2446 |
| Previous Daily Low | 1.2379 |
| Previous Weekly High | 1.2548 |
| Previous Weekly Low | 1.2379 |
| Previous Monthly High | 1.2841 |
| Previous Monthly Low | 1.2548 |
| Daily Fibonacci 38.2% | 1.2405 |
| Daily Fibonacci 61.8% | 1.2420 |
| Daily Pivot Point S1 | 1.2359 |
| Daily Pivot Point S2 | 1.2336 |
| Daily Pivot Point S3 | 1.2292 |
| Daily Pivot Point R1 | 1.2426 |
| Daily Pivot Point R2 | 1.2470 |
| Daily Pivot Point R3 | 1.2494 |
[/s2If]
Download Nehcap EAWe have two EAs that are operational on our LIVE accounts.
- EA-FIX: Check out the details here. Download EA-FIX . EA-FIX is a non-grid HFT scalper.
- EA-GROWTH: High quality low dd EA using trend grids. Download EA_GROWTHJoin Our Telegram Group
")


