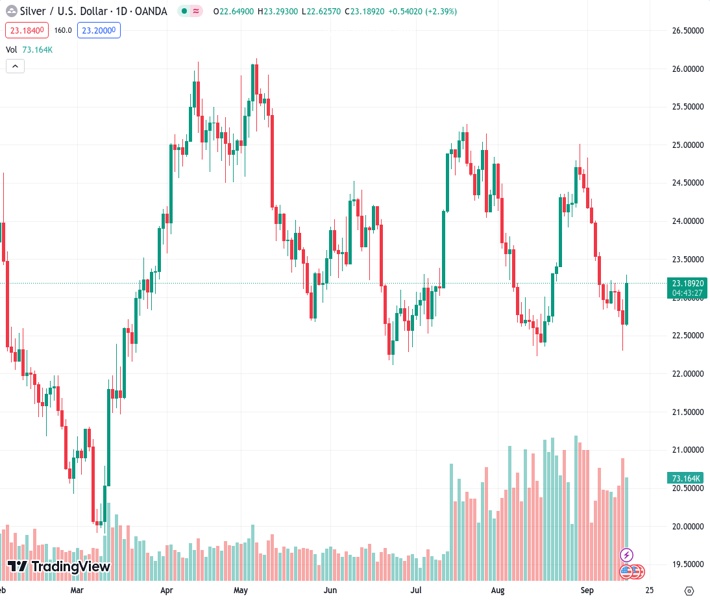
The XAGUSD rose by 2.20% and reached a price of $23.20.
…
This is a premium post.
[s2If !current_user_can(access_s2member_level4)]Please register for FREE REGISTER to read full post below containing analysis. In case of any error or you think you are not able to read the full post below, please email us at support#nehcap.com [lwa][/s2If] [s2If current_user_can(access_s2member_level1)]
- XAG/USD advanced by 2.20% to $23.20.
The pair currently trades last at 23.194.
The previous day high was 22.98 while the previous day low was 22.3. The daily 38.2% Fib levels comes at 22.56, expected to provide support. Similarly, the daily 61.8% fib level is at 22.72, expected to provide support.
At the end of the week, the XAG/USD Silver Spot price gained significant demand and increased to $23.15. On the US Dollar side, it’s consolidating, but its DXY index continues to trade at multi-month highs. Attention is now set on the Federal Reserve (Fed) decision next week, and markets remaining cautious seem to benefit the grey metal.
According to the CME FedWatch tool, a pause is practically priced in, but investors bets on the November and December meetings determine the Greenback’s price dynamics. Fundamentally, Fed officials have the green light to hike on more time as the economy hasn’t cooled down, and Chair Powell stated that ongoing decisions will be carefully decided according to the incoming data. So far, inflation accelerated in August, and economic activity is holding firm, so the Fed may have one more hike up their sleeves.
On the data front, the University of Michigan reported that September’s Consumer Sentiment Index declined to 67.7, lower than the expected and previous figures of 69.1 and 69.5, respectively. The initial reaction was a decline in the DXY index from 105.30 to 105.15. US Treasury yields on the 2,5 and 10-year bonds are holding firm at 5.03%, 4.40% and 4.30%, cushioning the Greenback’s losses and limiting the XAG/USD’s potential.
Analysing the daily chart, it is apparent that the XAG/USD has a neutral to bullish technical stance, with the bulls gradually recovering ground. The Relative Strength Index (RSI) displays an ascending slope in the bearish territory, hinting at a potential trend reversal, while the Moving Average Convergence (MACD) exhibits decreasing red bars. However, the price is below the 20,100 and 200-day Simple Moving Averages (SMAs), suggesting that the buyers are struggling to overcome the overall bearish trend and the bears are still in charge.
Support levels: $23.00, $22.90, $22.70.
Resistance levels: $23.30-70 (20,100,200-day SMA convergence)
Technical Levels: Supports and Resistances
XAGUSD currently trading at 23.18 at the time of writing. Pair opened at 22.65 and is trading with a change of 2.34 % .
| Overview | Overview.1 | |
|---|---|---|
| 0 | Today last price | 23.18 |
| 1 | Today Daily Change | 0.53 |
| 2 | Today Daily Change % | 2.34 |
| 3 | Today daily open | 22.65 |
The pair remains strongly bearish on the daily time frame. It trades below the 20 SMA @ 23.63, 50 SMA 23.74, 100 SMA @ 23.76 and 200 SMA @ 23.48.
| Trends | Trends.1 | |
|---|---|---|
| 0 | Daily SMA20 | 23.63 |
| 1 | Daily SMA50 | 23.74 |
| 2 | Daily SMA100 | 23.76 |
| 3 | Daily SMA200 | 23.48 |
The previous day high was 22.98 while the previous day low was 22.3. The daily 38.2% Fib levels comes at 22.56, expected to provide support. Similarly, the daily 61.8% fib level is at 22.72, expected to provide support.
Note the levels of interest below:
- Pivot support is noted at 22.31, 21.97, 21.63
- Pivot resistance is noted at 22.99, 23.32, 23.67
| Levels | Levels.1 |
|---|---|
| Previous Daily High | 22.98 |
| Previous Daily Low | 22.30 |
| Previous Weekly High | 24.30 |
| Previous Weekly Low | 22.83 |
| Previous Monthly High | 25.02 |
| Previous Monthly Low | 22.23 |
| Daily Fibonacci 38.2% | 22.56 |
| Daily Fibonacci 61.8% | 22.72 |
| Daily Pivot Point S1 | 22.31 |
| Daily Pivot Point S2 | 21.97 |
| Daily Pivot Point S3 | 21.63 |
| Daily Pivot Point R1 | 22.99 |
| Daily Pivot Point R2 | 23.32 |
| Daily Pivot Point R3 | 23.67 |
[/s2If]
Download Nehcap EAWe have two EAs that are operational on our LIVE accounts.
- EA-FIX: Check out the details here. Download EA-FIX . EA-FIX is a non-grid HFT scalper.
- EA-GROWTH: High quality low dd EA using trend grids. Download EA_GROWTHJoin Our Telegram Group
")


