The USDCNH currency pair is moving back from the gains made the previous day due to the release of favorable economic data from China.
…
This is a premium post.
[s2If !current_user_can(access_s2member_level4)]Please register for FREE REGISTER to read full post below containing analysis. In case of any error or you think you are not able to read the full post below, please email us at support#nehcap.com [lwa][/s2If] [s2If current_user_can(access_s2member_level1)]
- USD/CNH retraces the previous day’s gains on China’s positive economic data.
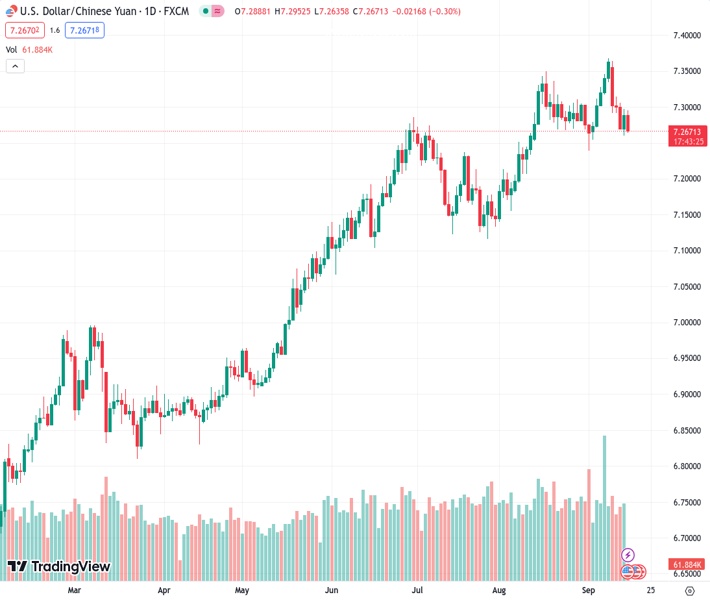
The pair currently trades last at 7.26770.
The previous day high was 7.2972 while the previous day low was 7.2608. The daily 38.2% Fib levels comes at 7.2833, expected to provide resistance. Similarly, the daily 61.8% fib level is at 7.2747, expected to provide resistance.
USD/CNH retreats from the previous day’s gains, trading lower around 7.2700 during the Asian session on Friday. The pair is experiencing downward pressure due to China’s upbeat macro data.
National Bureau of Statistics (NBS) in China has reported that Retail Sales year-over-year improved by 4.6%, surpassing expectations of 3.0% in August and an improvement from the previous figure of 2.5%. Additionally, Industrial Production (YoY) also exceeded estimates, showing a growth of 4.5% in August compared to a 3.7% rise in July.
These positive economic indicators have been accompanied by additional stimulus measures from China, contributing to an optimistic market sentiment. This optimism is putting pressure on the USD/CNH pair.
People’s Bank of China (PBoC) has acted by reducing the Reserve Requirement Ratio (RRR) for a significant portion of the banking system by 25 basis points (bps). This marks the second such reduction this year and is expected to inject more liquidity into the economy, potentially bolstering growth in the world’s second-largest economy.
China’s actions to boost liquidity and support growth are noteworthy, the USD’s trajectory remains influenced by the Fed’s policy stance, which could act as a supporting factor for USD/CNH bulls.
US Dollar Index (DXY), which measures the performance of the US Dollar (USD) against six other major currencies, is currently trading near its six-month highs that were reached on Thursday. The spot price is hovering around 105.30 at the time of writing.
US Dollar (USD) is embracing the positive economic data out of the United States (US). The latest data on US Initial Jobless Claims for the week ending September 8 showed a reading of 220,000 new claimants, which was better than the forecasted 225,000. This figure also represented a slight improvement from the previous week’s reading of 217,000.
Core Producer Price Index (PPI) for August met expectations with a 2.2% increase, slightly lower than the previous rate of a 2.4% hike. Additionally, Retail Sales showed improvement, rising to 0.6% compared to the previous month’s 0.5% figure. This result exceeded market expectations, which had anticipated a slowdown to 0.2%.
Nonetheless, the CME FedWatch Tool has lowered the probability to 35% that the US Federal Reserve (Fed) will carry out a 25 basis points (bps) rate hike in November. This development could reinforce the market caution regarding the likelihood of such a move as the traders carefully assess the evolving economic outlook and the communication coming from the Fed.
Market participants will likely monitor the release of the US preliminary Michigan Consumer Sentiment Index scheduled later in the North American session. Expectations are for a minor decline from a reading of 69.1 to 69.5.
In case the actual reading aligns with or surpasses these expectations, it could potentially give the US Dollar (USD) the boost it needs to sustain its upward momentum. The data could provide insights into consumer sentiment and can influence market sentiment and trading decisions about the Greenback.
Technical Levels: Supports and Resistances
USDCNH currently trading at 7.2704 at the time of writing. Pair opened at 7.29 and is trading with a change of -0.27 % .
| Overview | Overview.1 | |
|---|---|---|
| 0 | Today last price | 7.2704 |
| 1 | Today Daily Change | -0.0196 |
| 2 | Today Daily Change % | -0.2700 |
| 3 | Today daily open | 7.2900 |
The pair is trading below its 20 Daily moving average @ 7.2983, above its 50 Daily moving average @ 7.2439 , above its 100 Daily moving average @ 7.1698 and above its 200 Daily moving average @ 7.0235
| Trends | Trends.1 | |
|---|---|---|
| 0 | Daily SMA20 | 7.2983 |
| 1 | Daily SMA50 | 7.2439 |
| 2 | Daily SMA100 | 7.1698 |
| 3 | Daily SMA200 | 7.0235 |
The previous day high was 7.2972 while the previous day low was 7.2608. The daily 38.2% Fib levels comes at 7.2833, expected to provide resistance. Similarly, the daily 61.8% fib level is at 7.2747, expected to provide resistance.
Note the levels of interest below:
- Pivot support is noted at 7.2682, 7.2464, 7.2319
- Pivot resistance is noted at 7.3045, 7.319, 7.3408
| Levels | Levels.1 |
|---|---|
| Previous Daily High | 7.2972 |
| Previous Daily Low | 7.2608 |
| Previous Weekly High | 7.3682 |
| Previous Weekly Low | 7.2548 |
| Previous Monthly High | 7.3496 |
| Previous Monthly Low | 7.1452 |
| Daily Fibonacci 38.2% | 7.2833 |
| Daily Fibonacci 61.8% | 7.2747 |
| Daily Pivot Point S1 | 7.2682 |
| Daily Pivot Point S2 | 7.2464 |
| Daily Pivot Point S3 | 7.2319 |
| Daily Pivot Point R1 | 7.3045 |
| Daily Pivot Point R2 | 7.3190 |
| Daily Pivot Point R3 | 7.3408 |
[/s2If]
Download Nehcap EAWe have two EAs that are operational on our LIVE accounts.
- EA-FIX: Check out the details here. Download EA-FIX . EA-FIX is a non-grid HFT scalper.
- EA-GROWTH: High quality low dd EA using trend grids. Download EA_GROWTHJoin Our Telegram Group
")


