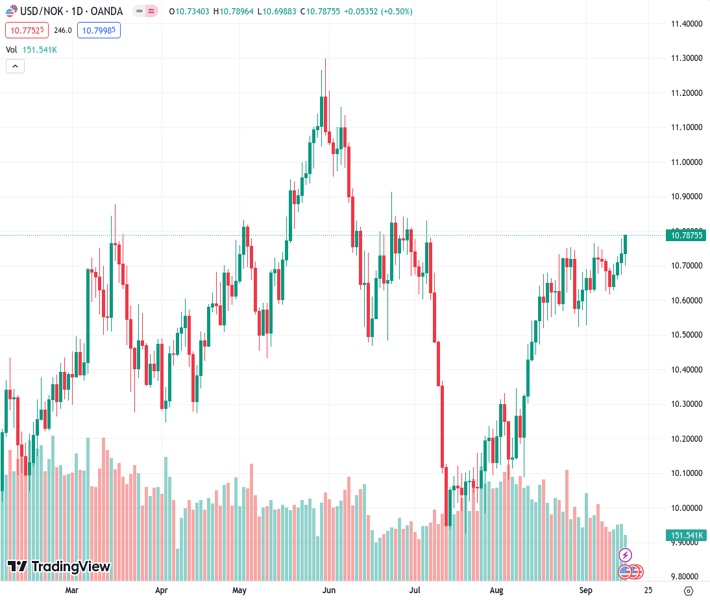
The USD to NOK exchange rate, which was at 10.77079, experienced a positive change on Friday, increasing by 0.50% from its previous rate of 10.788.
…
This is a premium post.
[s2If !current_user_can(access_s2member_level4)]Please register for FREE REGISTER to read full post below containing analysis. In case of any error or you think you are not able to read the full post below, please email us at support#nehcap.com [lwa][/s2If] [s2If current_user_can(access_s2member_level1)]
- USD/NOK saw green on Friday, rising 0.50% above 10.788.
The pair currently trades last at 10.77079.
The previous day high was 10.779 while the previous day low was 10.6729. The daily 38.2% Fib levels comes at 10.7385, expected to provide support. Similarly, the daily 61.8% fib level is at 10.7134, expected to provide support.
On the last day of the week, the USD/NOK gained additional traction, rising to multi-month highs above 10.788.
On the NOK’s side, Norges Bank (NB) is anticipated to announce a 25 basis point hike, bringing the key rate to 4.25% in the next week and will likely be the last increase of its tightening cycle. However, the bank is expected to maintain rates at restrictive levels to reassure, and incoming data will ultimately decide when the first rate cut will come or when the bank will maintain rates highs. In the meantime, recent economic data, including inflation numbers and the Norwegian Krone (NOK) stability, have generally aligned with the central bank’s expectations.
For next week’s Federal Reserve (Fed) decision, markets have already warranted a pause, but attention is set on the monetary policy statement and Chair Powell’s tone. The last data sets have shown that the US economy is holding firm, seemingly achieving a soft landing while inflation figures accelerated in August, so one more hike will be justified. As for now, the CME FedWatch tool indicates that the odds of a 25 basis point hike in November or December have somewhat eased to 35%.
Based on the daily chart, the USD/NOK exhibits a bullish outlook for the short term. Both the Relative Strength Index (RSI) and Moving Average Convergence Divergence (MACD) remain in positive territory, with the RSI above its midline and showing a northward slope. The MACD is also displaying green bars, indicating a strengthening bullish momentum. Furthermore, the pair is above the 20,100,200-day Simple Moving Average (SMA), suggesting that the bulls are firmly in control of the bigger picture.
Support levels: 10.703,10.671 (20-day SMA), 10.625.
Resistance levels: 10.779, 10.837, 10.850.
Technical Levels: Supports and Resistances
USDNOK currently trading at 10.7882 at the time of writing. Pair opened at 10.7354 and is trading with a change of 0.49 % .
| Overview | Overview.1 | |
|---|---|---|
| 0 | Today last price | 10.7882 |
| 1 | Today Daily Change | 0.0528 |
| 2 | Today Daily Change % | 0.4900 |
| 3 | Today daily open | 10.7354 |
The pair remains strongly bullish on the daily timeframe. It trades above its 20 SMA @ 10.6663, 50 SMA 10.4097, 100 SMA @ 10.6007 and 200 SMA @ 10.4156.
| Trends | Trends.1 | |
|---|---|---|
| 0 | Daily SMA20 | 10.6663 |
| 1 | Daily SMA50 | 10.4097 |
| 2 | Daily SMA100 | 10.6007 |
| 3 | Daily SMA200 | 10.4156 |
The previous day high was 10.779 while the previous day low was 10.6729. The daily 38.2% Fib levels comes at 10.7385, expected to provide support. Similarly, the daily 61.8% fib level is at 10.7134, expected to provide support.
Note the levels of interest below:
- Pivot support is noted at 10.6793, 10.6231, 10.5732
- Pivot resistance is noted at 10.7853, 10.8352, 10.8914
| Levels | Levels.1 |
|---|---|
| Previous Daily High | 10.7790 |
| Previous Daily Low | 10.6729 |
| Previous Weekly High | 10.7652 |
| Previous Weekly Low | 10.6215 |
| Previous Monthly High | 10.7518 |
| Previous Monthly Low | 10.0804 |
| Daily Fibonacci 38.2% | 10.7385 |
| Daily Fibonacci 61.8% | 10.7134 |
| Daily Pivot Point S1 | 10.6793 |
| Daily Pivot Point S2 | 10.6231 |
| Daily Pivot Point S3 | 10.5732 |
| Daily Pivot Point R1 | 10.7853 |
| Daily Pivot Point R2 | 10.8352 |
| Daily Pivot Point R3 | 10.8914 |
[/s2If]
Download Nehcap EAWe have two EAs that are operational on our LIVE accounts.
- EA-FIX: Check out the details here. Download EA-FIX . EA-FIX is a non-grid HFT scalper.
- EA-GROWTH: High quality low dd EA using trend grids. Download EA_GROWTHJoin Our Telegram Group
")


