The GBPUSD pair has seen a slight improvement and has distanced itself from a low point that was reached on Thursday, marking a positive movement.
…
This is a premium post.
[s2If !current_user_can(access_s2member_level4)]Please register for FREE REGISTER to read full post below containing analysis. In case of any error or you think you are not able to read the full post below, please email us at support#nehcap.com [lwa][/s2If] [s2If current_user_can(access_s2member_level1)]
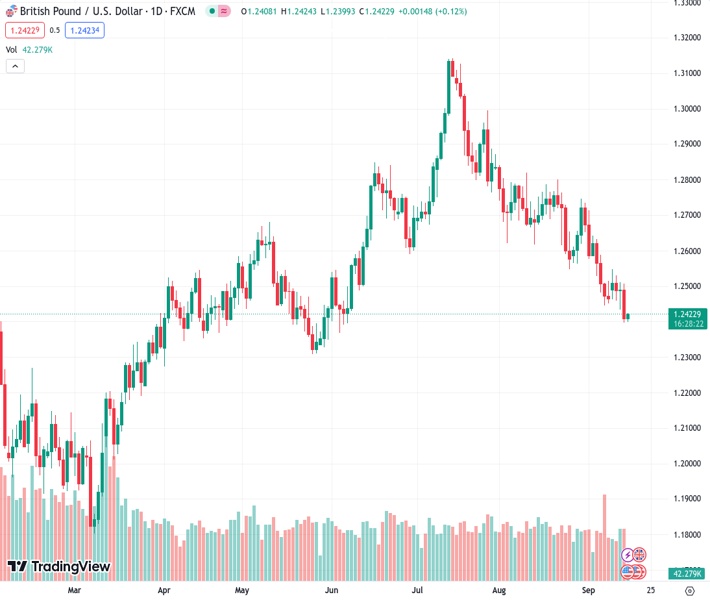
- GBP/USD gains some positive traction and moves away from a multi-month low set on Thursday.
The pair currently trades last at 1.24242.
The previous day high was 1.2506 while the previous day low was 1.2397. The daily 38.2% Fib levels comes at 1.2438, expected to provide resistance. Similarly, the daily 61.8% fib level is at 1.2464, expected to provide resistance.
The GBP/USD pair shows some resilience below the 1.2400 mark for the second successive day and attracts some buyers during the Asian session on Friday. Spot prices have now reversed a part of the previous day’s fall to over a three-month low and currently trade around the 1.2420-1.2425 region, up 0.10% for the day, though any meaningful recovery still seems elusive.
The US Dollar (USD) bulls opt to take some profits off the table after the recent rally to the highest level since March 9, which, in turn, is seen as a key factor lending some support to the GBP/USD pair. Against the backdrop of the optimism over more stimulus from China, the mostly upbeat Chinese macro data boosts investors’ confidence and prompts some selling around the safe-haven Greenback. Apart from this, a modest downtick in the US Treasury bond yields further undermines the buck, though expectations that the Federal Reserve (Fed) will stick to its hawkish stance should limit any meaningful downside.
The US central bank is widely expected to pause its rate-hiking cycle at its meeting next week. Traders, however, are still pricing in the possibility of one more 25 bps lift-off in November or December. The bets were affirmed by better-than-expected US economic releases on Thursday. This comes on top of still-sticky inflation and should allow the Fed to keep interest rates higher for longer. The outlook, meanwhile, should act as a tailwind for the US bond yields and favour the USD bulls. Moreover, diminishing odds for a more aggressive policy tightening by the Bank of England (BoE) might cap the GBP/USD pair.
The Office for National Statistics reported on Thursday that Britain’s economy shrank at the quickest pace in seven months in July, by 0.5%, reviving recession fears. This, along with signs that the UK labour market is cooling, puts pressure on the BoE to pause its rate-hiking cycle. Furthermore, the overnight sustained break and close below a technically significant 200-day Simple Moving Average (SMA) suggests that the path of least resistance for the GBP/USD pair is to the downside. Hence, any subsequent move up might still be seen as a selling opportunity and runs the risk of fizzling out rather quickly.
Traders now look forward to the BoE survey on Consumer Inflation Expectations for some impetus. Later during the early North American session, the US economic docket – featuring the Empire State Manufacturing Index and Prelim Michigan Consumer Sentiment Index – might influence the USD price dynamics and contribute to producing short-term trading opportunities around the GBP/USD pair. Nevertheless, spot prices remain on track to end in the red for the second straight week and the aforementioned fundamental backdrop seems tilted firmly in favour of bearish traders.
Technical Levels: Supports and Resistances
GBPUSD currently trading at 1.2421 at the time of writing. Pair opened at 1.2409 and is trading with a change of 0.1 % .
| Overview | Overview.1 | |
|---|---|---|
| 0 | Today last price | 1.2421 |
| 1 | Today Daily Change | 0.0012 |
| 2 | Today Daily Change % | 0.1000 |
| 3 | Today daily open | 1.2409 |
The pair remains strongly bearish on the daily time frame. It trades below the 20 SMA @ 1.2595, 50 SMA 1.2742, 100 SMA @ 1.2655 and 200 SMA @ 1.2432.
| Trends | Trends.1 | |
|---|---|---|
| 0 | Daily SMA20 | 1.2595 |
| 1 | Daily SMA50 | 1.2742 |
| 2 | Daily SMA100 | 1.2655 |
| 3 | Daily SMA200 | 1.2432 |
The previous day high was 1.2506 while the previous day low was 1.2397. The daily 38.2% Fib levels comes at 1.2438, expected to provide resistance. Similarly, the daily 61.8% fib level is at 1.2464, expected to provide resistance.
Note the levels of interest below:
- Pivot support is noted at 1.2368, 1.2328, 1.2259
- Pivot resistance is noted at 1.2478, 1.2547, 1.2587
| Levels | Levels.1 |
|---|---|
| Previous Daily High | 1.2506 |
| Previous Daily Low | 1.2397 |
| Previous Weekly High | 1.2643 |
| Previous Weekly Low | 1.2446 |
| Previous Monthly High | 1.2841 |
| Previous Monthly Low | 1.2548 |
| Daily Fibonacci 38.2% | 1.2438 |
| Daily Fibonacci 61.8% | 1.2464 |
| Daily Pivot Point S1 | 1.2368 |
| Daily Pivot Point S2 | 1.2328 |
| Daily Pivot Point S3 | 1.2259 |
| Daily Pivot Point R1 | 1.2478 |
| Daily Pivot Point R2 | 1.2547 |
| Daily Pivot Point R3 | 1.2587 |
[/s2If]
Download Nehcap EAWe have two EAs that are operational on our LIVE accounts.
- EA-FIX: Check out the details here. Download EA-FIX . EA-FIX is a non-grid HFT scalper.
- EA-GROWTH: High quality low dd EA using trend grids. Download EA_GROWTHJoin Our Telegram Group
")


