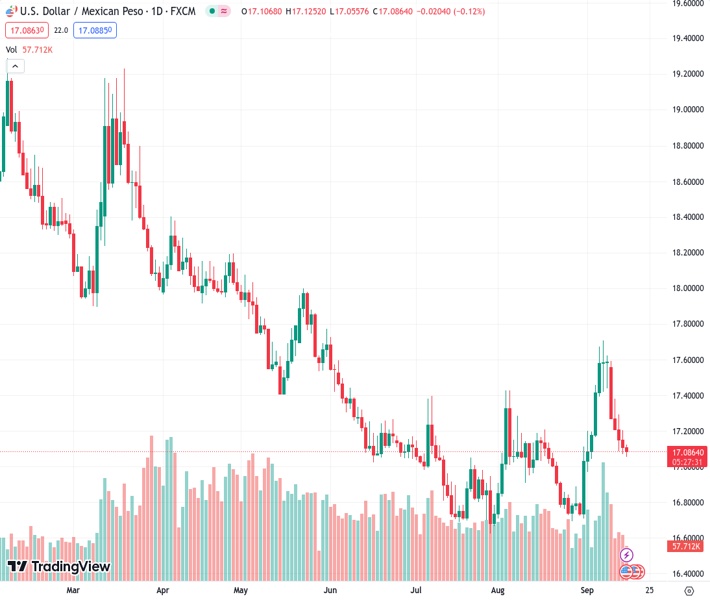
The currency pair USDMXN is currently trading at a lower value of 17.0741, which is a decrease of 0.19%, since it has fallen below its 20-day Moving Average. The pair is now aiming to reach the significant level of 17.0000.
…
This is a premium post.
[s2If !current_user_can(access_s2member_level4)]Please register for FREE REGISTER to read full post below containing analysis. In case of any error or you think you are not able to read the full post below, please email us at support#nehcap.com [lwa][/s2If] [s2If current_user_can(access_s2member_level1)]
- USD/MXN trades at 17.0741, down 0.19%, as the pair slides below the 20-day Moving Average, targeting the psychological 17.0000 level.
The pair currently trades last at 17.0893.
The previous day high was 17.209 while the previous day low was 17.0734. The daily 38.2% Fib levels comes at 17.1252, expected to provide resistance. Similarly, the daily 61.8% fib level is at 17.1572, expected to provide resistance.
The Mexican Peso (MXN) extends its gains versus the US Dollar (USD), and prolongs its rally to five consecutive days, with USD/MXN bears setting their sight on the 17.0000 psychological level after sliding below the 20-day Moving Average (DMA) at 17.0921. The pair exchanges hands at 17.0741, down 0.19%.
Data from the United States (US) so far failed to bolster the Greenback (USD) as inflation expectations dropped the most in two years, as revealed by the University of Michigan (UoM) Consumer Sentiment poll. Inflation is expected to climb at a 3.1% pace, down from August 3.5%, and estimate a 2.7% jump over a 10-year period. Despite America’s optimism on inflation, sentiment fell to 677 below estimates of 69.1, blamed on high food and energy prices.
Before Wall Street opened, Industrial Production in August rose by 0.4% MoM, below July’s 1% increase but above the 0.1% estimated by the consensus, as the US Federal Reserve revealed. That depicts consumers taking a breather as retailers posted limited orders on manufacturers, struggling with higher borrowing costs and uncertainty on demand.
At the same time, the New York Fed revealed its Manufacturing Index, which expanded this month from -21 to 1.9, exceeding forecasts of -10. Given the amount of data posting positive surprises about the US economy, investors remain hesitant that the US Federal Reserve would continue to tighten monetary policy past the September meeting.
Across the border, a scarce economic docket left USD/MXN traders adrift to market sentiment and US Dollar dynamics. Nevertheless, next week’s agenda will be busy, with the release of Private Spending, Aggregate Demand, Retail Sales, Economic Activity, and inflation for the first half of September.
The USD/MXN remains neutrally biased despite printing a new multi-month high. After reaching 17.7074, the pair’s pullback could offer buyers a better entry price than last week’s close. However, downside risks remain and emerge slightly below the 50-DMA at 17.0079. Once cleared, a test of the August 28 swing low of 16.6923 is on the cards. On the other hand, if buyers reclaim the 100-DMA at 17.2271, that would exacerbate a recovery towards September’s high of 17.7074.
Technical Levels: Supports and Resistances
USDMXN currently trading at 17.0887 at the time of writing. Pair opened at 17.1102 and is trading with a change of -0.13 % .
| Overview | Overview.1 | |
|---|---|---|
| 0 | Today last price | 17.0887 |
| 1 | Today Daily Change | -0.0215 |
| 2 | Today Daily Change % | -0.1300 |
| 3 | Today daily open | 17.1102 |
The pair is trading below its 20 Daily moving average @ 17.0975, above its 50 Daily moving average @ 17.0163 , below its 100 Daily moving average @ 17.2425 and below its 200 Daily moving average @ 17.9696
| Trends | Trends.1 | |
|---|---|---|
| 0 | Daily SMA20 | 17.0975 |
| 1 | Daily SMA50 | 17.0163 |
| 2 | Daily SMA100 | 17.2425 |
| 3 | Daily SMA200 | 17.9696 |
The previous day high was 17.209 while the previous day low was 17.0734. The daily 38.2% Fib levels comes at 17.1252, expected to provide resistance. Similarly, the daily 61.8% fib level is at 17.1572, expected to provide resistance.
Note the levels of interest below:
- Pivot support is noted at 17.0527, 16.9952, 16.9171
- Pivot resistance is noted at 17.1883, 17.2664, 17.3239
| Levels | Levels.1 |
|---|---|
| Previous Daily High | 17.2090 |
| Previous Daily Low | 17.0734 |
| Previous Weekly High | 17.7094 |
| Previous Weekly Low | 17.0447 |
| Previous Monthly High | 17.4274 |
| Previous Monthly Low | 16.6945 |
| Daily Fibonacci 38.2% | 17.1252 |
| Daily Fibonacci 61.8% | 17.1572 |
| Daily Pivot Point S1 | 17.0527 |
| Daily Pivot Point S2 | 16.9952 |
| Daily Pivot Point S3 | 16.9171 |
| Daily Pivot Point R1 | 17.1883 |
| Daily Pivot Point R2 | 17.2664 |
| Daily Pivot Point R3 | 17.3239 |
[/s2If]
Download Nehcap EAWe have two EAs that are operational on our LIVE accounts.
- EA-FIX: Check out the details here. Download EA-FIX . EA-FIX is a non-grid HFT scalper.
- EA-GROWTH: High quality low dd EA using trend grids. Download EA_GROWTHJoin Our Telegram Group
")


