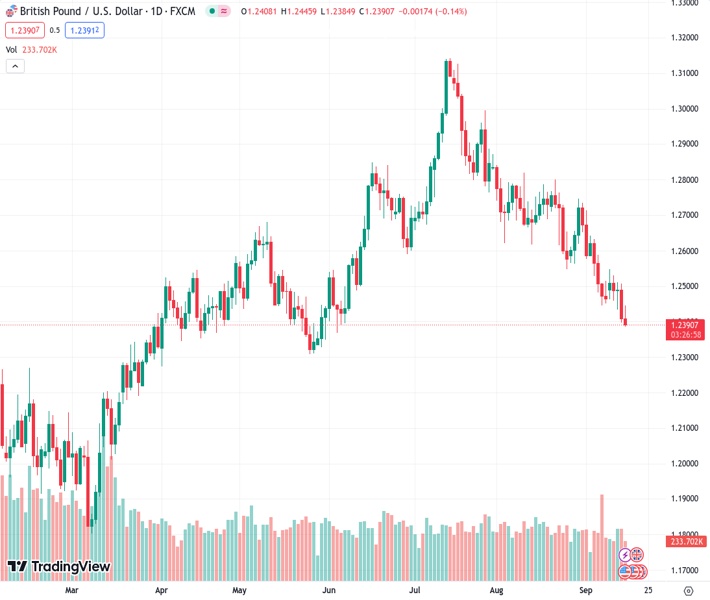
As the economic data in the US improves, the GBPUSD currency pair is trading at 1.2397, falling below its 200-day Moving Average.
…
This is a premium post.
[s2If !current_user_can(access_s2member_level4)]Please register for FREE REGISTER to read full post below containing analysis. In case of any error or you think you are not able to read the full post below, please email us at support#nehcap.com [lwa][/s2If] [s2If current_user_can(access_s2member_level1)]
- As US economic data strengthens the dollar, GBP/USD trades at 1.2397, slipping below its 200-day Moving Average.
The pair currently trades last at 1.23924.
The previous day high was 1.2506 while the previous day low was 1.2397. The daily 38.2% Fib levels comes at 1.2438, expected to provide resistance. Similarly, the daily 61.8% fib level is at 1.2464, expected to provide resistance.
The Pound Sterling (GBP) continues to weaken against the US Dollar (USD) for the second consecutive day after a tranche of positive US economic data bolstered the Greenback. Hence, the GBP/USD is set to finish the week with losses, exchanging hands at 1.2397, below its 200-day Moving Average (DMA).
Sentiment shifted sour, bolstering appetite for safe-haven assets, notably the US Dollar. Data revealed on Friday showed Americans’ inflation expectations were lowered, as demonstrated by the University of Michigan (UoM) poll. Inflation is expected to rise to 3.1% below August’s reading for one year, and it is projected at 2.7% for a ten-year period. Despite people’s high spirits, consumer sentiment dropped to 67.7, below forecasts of 69.1.
The US Federal Reserve earlier revealed that Industrial Production expanded 0.4% MoM, below July’s 1% but above the consensus forecasts. Further data released by the New York Fed showed its Empire State Manufacturing Index for September improved to 1.9 from a -21 figure in August, above forecasts of a -10 drop.
In the meantime, money market futures remain skeptical that the US Federal Reserve would hike rates once more before the year’s end, as shown by the CME FedWatch Tool. For the next week, the US central bank is projected to hold rates, and for November, odds for a 25 bps hike lie at a decent 32.45% chance.
Nevertheless, US Treasury bond yields advanced, as the latest inflation reports on the consumer and producer side revealed an uptick after decelerating sharply through the year. The US 10-year Treasury Note yields 4.326%, but the buck is losing some steam.
Across the pond, the Bank of England (BoE) is expected to raise rates by 25 bps, though it faces some challenges, like a slowdown in the economy. The Bank Rate would be lifted toward 5.50%, but traders scaled back previous bets the BoE would lift rates toward 6%, as odds for the November 2 meeting are around 15%.
The Fed would likely keep rates unchanged on the US front, but its economy remains solid, and investors are optimistic the US central bank would achieve a soft landing. Therefore, further downward action is expected in the GBP/USD, as monetary policy could suggest the BoE would be the first to blink and cut rates.
Since peaking at around 1.3140s, the major is in a downward trend, with the GBP/USD threatening to achieve a daily close below the 200-day Moving Average (DMA) at 1.2430, further reinforcing that sellers are in charge. Price action would put the May 25 swing low of 1.2308 into play before the pair nosedives toward the March 8 swing low of 1.1802. Contrarily, buyers must reclaim the 200-DMA and lift the exchange rate past the August 25 swing low of 1.2548 to remain hopeful of reaching higher prices.
Technical Levels: Supports and Resistances
GBPUSD currently trading at 1.2397 at the time of writing. Pair opened at 1.2409 and is trading with a change of -0.1 % .
| Overview | Overview.1 | |
|---|---|---|
| 0 | Today last price | 1.2397 |
| 1 | Today Daily Change | -0.0012 |
| 2 | Today Daily Change % | -0.1000 |
| 3 | Today daily open | 1.2409 |
The pair remains strongly bearish on the daily time frame. It trades below the 20 SMA @ 1.2595, 50 SMA 1.2742, 100 SMA @ 1.2655 and 200 SMA @ 1.2432.
| Trends | Trends.1 | |
|---|---|---|
| 0 | Daily SMA20 | 1.2595 |
| 1 | Daily SMA50 | 1.2742 |
| 2 | Daily SMA100 | 1.2655 |
| 3 | Daily SMA200 | 1.2432 |
The previous day high was 1.2506 while the previous day low was 1.2397. The daily 38.2% Fib levels comes at 1.2438, expected to provide resistance. Similarly, the daily 61.8% fib level is at 1.2464, expected to provide resistance.
Note the levels of interest below:
- Pivot support is noted at 1.2368, 1.2328, 1.2259
- Pivot resistance is noted at 1.2478, 1.2547, 1.2587
| Levels | Levels.1 |
|---|---|
| Previous Daily High | 1.2506 |
| Previous Daily Low | 1.2397 |
| Previous Weekly High | 1.2643 |
| Previous Weekly Low | 1.2446 |
| Previous Monthly High | 1.2841 |
| Previous Monthly Low | 1.2548 |
| Daily Fibonacci 38.2% | 1.2438 |
| Daily Fibonacci 61.8% | 1.2464 |
| Daily Pivot Point S1 | 1.2368 |
| Daily Pivot Point S2 | 1.2328 |
| Daily Pivot Point S3 | 1.2259 |
| Daily Pivot Point R1 | 1.2478 |
| Daily Pivot Point R2 | 1.2547 |
| Daily Pivot Point R3 | 1.2587 |
[/s2If]
Download Nehcap EAWe have two EAs that are operational on our LIVE accounts.
- EA-FIX: Check out the details here. Download EA-FIX . EA-FIX is a non-grid HFT scalper.
- EA-GROWTH: High quality low dd EA using trend grids. Download EA_GROWTHJoin Our Telegram Group
")


