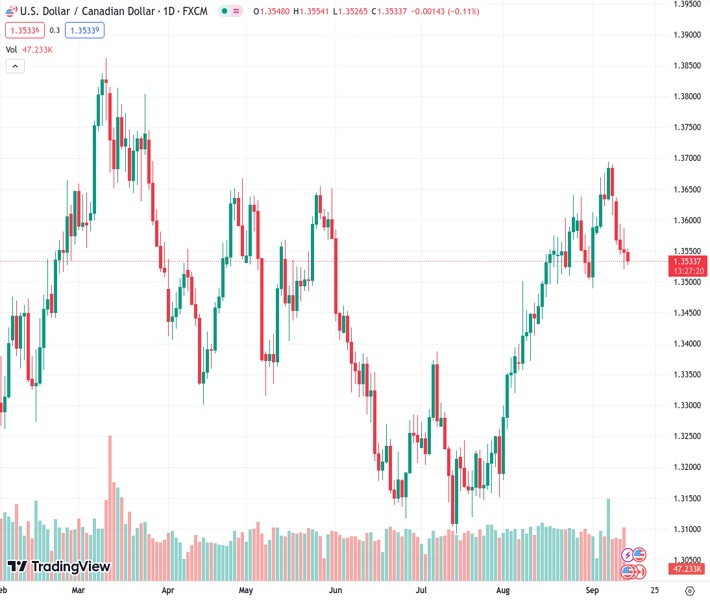
The USDCAD pair remains steady below the 1.3550 level in anticipation of the release of US data.
…
This is a premium post.
[s2If !current_user_can(access_s2member_level4)]Please register for FREE REGISTER to read full post below containing analysis. In case of any error or you think you are not able to read the full post below, please email us at support#nehcap.com [lwa][/s2If] [s2If current_user_can(access_s2member_level1)]
- USD/CAD holds ground below 1.3550 ahead of the US data.
The pair currently trades last at 1.35352.
The previous day high was 1.3587 while the previous day low was 1.3521. The daily 38.2% Fib levels comes at 1.3546, expected to provide resistance. Similarly, the daily 61.8% fib level is at 1.3562, expected to provide resistance.
USD/CAD continues its five-day losing streak, maintaining a negative bias and trading around 1.3540 during the early hours of the European session on Thursday. This downward pressure on the pair could be attributed to the rise in crude oil prices.
Market participants will likely monitor the upcoming data releases from the United States (US), including the Core Producer Price Index (PPI) and Retail Sales figures for August. These data sets will offer insights into economic activities in the US and can help traders in formulating their strategies for trading the USD/CAD pair.
The pair could encounter initial support around the 1.3500 psychological level, following the 38.2% Fibonacci retracement at 1.3466. A break below that level could influence the USD/CAD pair to navigate the region below the 1.3450 psychological level.
On the upside, an immediate barrier for the USD/CAD pair appears around the 23.6% Fibonacci retracement at 1.3553, followed by the nine-day Exponential Moving Average (EMA) at 1.3575.
A firm break above the 1.3600 psychological level could provide support for US Dollar (USD) buyers, allowing them to potentially target the area around the weekly high at 1.3636 following the 1.3700 psychological level.
The Moving Average Convergence Divergence (MACD) line remains above the centerline but shows divergence below the signal line. This configuration suggests a potential momentum shift in the market, which can be seen as a signal that the recent upward trend may start to weaken.
Traders of the USD/CAD pair will likely observe the 14-day Relative Strength Index (RSI), which suggests no significant momentum in either direction in the short term as it lies on the 50 level.
Technical Levels: Supports and Resistances
USDCAD currently trading at 1.3538 at the time of writing. Pair opened at 1.3549 and is trading with a change of -0.08 % .
| Overview | Overview.1 | |
|---|---|---|
| 0 | Today last price | 1.3538 |
| 1 | Today Daily Change | -0.0011 |
| 2 | Today Daily Change % | -0.0800 |
| 3 | Today daily open | 1.3549 |
The pair is trading below its 20 Daily moving average @ 1.3578, above its 50 Daily moving average @ 1.3406 , above its 100 Daily moving average @ 1.3404 and above its 200 Daily moving average @ 1.3466
| Trends | Trends.1 | |
|---|---|---|
| 0 | Daily SMA20 | 1.3578 |
| 1 | Daily SMA50 | 1.3406 |
| 2 | Daily SMA100 | 1.3404 |
| 3 | Daily SMA200 | 1.3466 |
The previous day high was 1.3587 while the previous day low was 1.3521. The daily 38.2% Fib levels comes at 1.3546, expected to provide resistance. Similarly, the daily 61.8% fib level is at 1.3562, expected to provide resistance.
Note the levels of interest below:
- Pivot support is noted at 1.3518, 1.3486, 1.3451
- Pivot resistance is noted at 1.3584, 1.3619, 1.365
| Levels | Levels.1 |
|---|---|
| Previous Daily High | 1.3587 |
| Previous Daily Low | 1.3521 |
| Previous Weekly High | 1.3694 |
| Previous Weekly Low | 1.3576 |
| Previous Monthly High | 1.3640 |
| Previous Monthly Low | 1.3184 |
| Daily Fibonacci 38.2% | 1.3546 |
| Daily Fibonacci 61.8% | 1.3562 |
| Daily Pivot Point S1 | 1.3518 |
| Daily Pivot Point S2 | 1.3486 |
| Daily Pivot Point S3 | 1.3451 |
| Daily Pivot Point R1 | 1.3584 |
| Daily Pivot Point R2 | 1.3619 |
| Daily Pivot Point R3 | 1.3650 |
[/s2If]
Download Nehcap EAWe have two EAs that are operational on our LIVE accounts.
- EA-FIX: Check out the details here. Download EA-FIX . EA-FIX is a non-grid HFT scalper.
- EA-GROWTH: High quality low dd EA using trend grids. Download EA_GROWTHJoin Our Telegram Group
")


