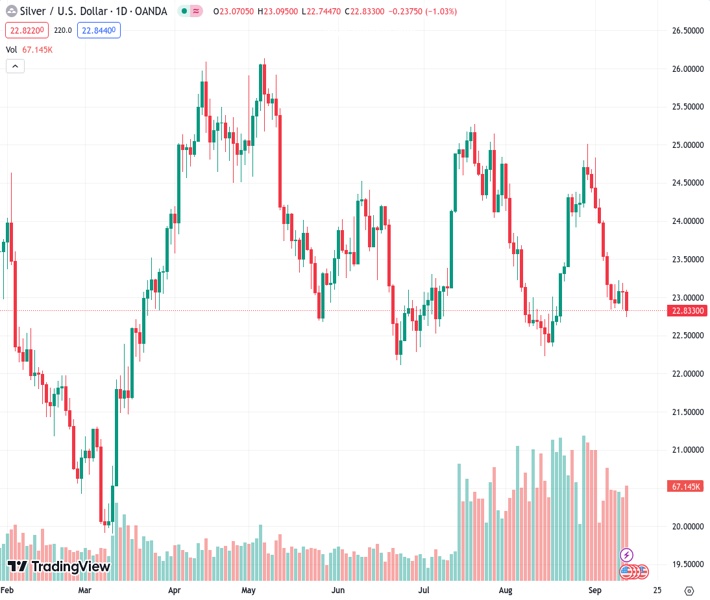
The XAGUSD currency pair, which was at 22.828, experienced a decrease of 0.90% and reached the $22.80 level.
…
This is a premium post.
[s2If !current_user_can(access_s2member_level4)]Please register for FREE REGISTER to read full post below containing analysis. In case of any error or you think you are not able to read the full post below, please email us at support#nehcap.com [lwa][/s2If] [s2If current_user_can(access_s2member_level1)]
- XAG/USD declined by 0.90% to the $22.80 area.
The pair currently trades last at 22.828.
The previous day high was 23.18 while the previous day low was 22.83. The daily 38.2% Fib levels comes at 22.97, expected to provide resistance. Similarly, the daily 61.8% fib level is at 23.05, expected to provide resistance.
In Wednesday’s session, Silver prices retreated and failed to consolidate above $23.00, falling to the $22.80 area. After fresh inflation figures from the US, the Greenback is holding its foot trading strong against its rivals while US Treasury yields are consolidating after initially spiking to a two-week high.
The US Bureau of Labour Statistics (BLS) revealed that the Consumer Price Index (CPI) rose to 3.7% YoY, up from 3.2% in July and beating the expected 3.6%. On the other hand, the Core measure decelerated to 4.3% from its previous reading of 4.7%, as markets expected.
In the meantime, the US 2,5 and 10-year bond yields saw a volatile action during the session, spiking after the release of the inflation figures and declining, seeing daily decreases of more than 0.50%. However, they still remain high, indicating that investors are still confident that the Federal Reserve (Fed) will hike one more time in 2023, and the CME FedWatch tool suggests that market swaps are discounting nearly 40% odds of a hike in November or December. In that sense, as yields remain high and hawkish bets on the Fed steady, the XAG/USD’s bulls will have a hard time as their upside potential will be limited.
On Thursday, the BLS will report Producer Price Index (PPI) figures from August, providing additional insights to investors to place their bets on the next Fed meetings.
The technical outlook for the XAG/USD indicates an oversold condition in the short term, suggesting a potential technical rebound in the near future. The Relative Strength Index (RSI) exhibits a negative slope below the 50 thresholds, while the Moving Average Convergence (MACD) histogram, displays larger red bars. Also, the pair is below the 20,100 and 200-day Simple Moving Averages (SMAs), highlighting the continued dominance of bears on the broader scale. To add to that, the moving averages seem to be converging towards the $23.50 and are building a strong resistance at that area.
Support levels:$22.60, $22.40, $22.00.
Resistance levels: $23.00, $23.50 (200-day SMA), $23.60 (20-day SMA).
Technical Levels: Supports and Resistances
XAGUSD currently trading at 22.84 at the time of writing. Pair opened at 23.07 and is trading with a change of -1.0 % .
| Overview | Overview.1 | |
|---|---|---|
| 0 | Today last price | 22.84 |
| 1 | Today Daily Change | -0.23 |
| 2 | Today Daily Change % | -1.00 |
| 3 | Today daily open | 23.07 |
The pair remains strongly bearish on the daily time frame. It trades below the 20 SMA @ 23.61, 50 SMA 23.74, 100 SMA @ 23.8 and 200 SMA @ 23.48.
| Trends | Trends.1 | |
|---|---|---|
| 0 | Daily SMA20 | 23.61 |
| 1 | Daily SMA50 | 23.74 |
| 2 | Daily SMA100 | 23.80 |
| 3 | Daily SMA200 | 23.48 |
The previous day high was 23.18 while the previous day low was 22.83. The daily 38.2% Fib levels comes at 22.97, expected to provide resistance. Similarly, the daily 61.8% fib level is at 23.05, expected to provide resistance.
Note the levels of interest below:
- Pivot support is noted at 22.88, 22.68, 22.52
- Pivot resistance is noted at 23.23, 23.38, 23.58
| Levels | Levels.1 |
|---|---|
| Previous Daily High | 23.18 |
| Previous Daily Low | 22.83 |
| Previous Weekly High | 24.30 |
| Previous Weekly Low | 22.83 |
| Previous Monthly High | 25.02 |
| Previous Monthly Low | 22.23 |
| Daily Fibonacci 38.2% | 22.97 |
| Daily Fibonacci 61.8% | 23.05 |
| Daily Pivot Point S1 | 22.88 |
| Daily Pivot Point S2 | 22.68 |
| Daily Pivot Point S3 | 22.52 |
| Daily Pivot Point R1 | 23.23 |
| Daily Pivot Point R2 | 23.38 |
| Daily Pivot Point R3 | 23.58 |
[/s2If]
Download Nehcap EAWe have two EAs that are operational on our LIVE accounts.
- EA-FIX: Check out the details here. Download EA-FIX . EA-FIX is a non-grid HFT scalper.
- EA-GROWTH: High quality low dd EA using trend grids. Download EA_GROWTHJoin Our Telegram Group
")


