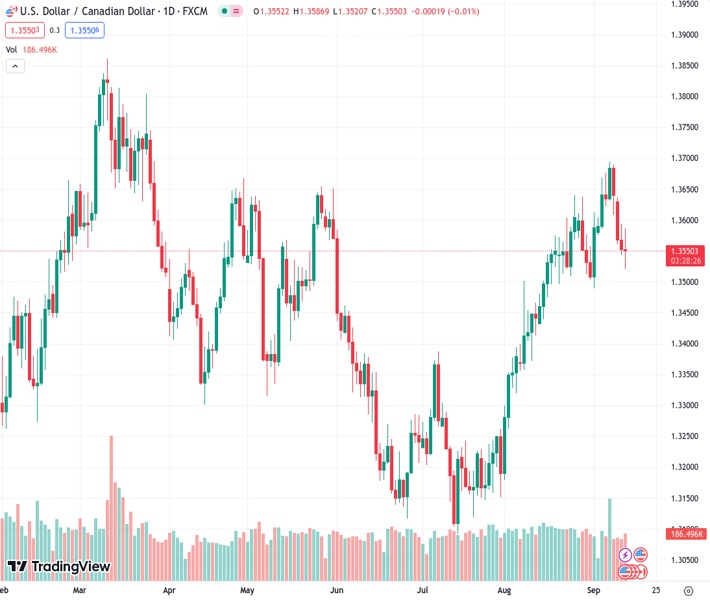
The USDCAD currency pair has been on a downward trend for the past four days and is currently being traded at a rate of 1.3545.
…
This is a premium post.
[s2If !current_user_can(access_s2member_level4)]Please register for FREE REGISTER to read full post below containing analysis. In case of any error or you think you are not able to read the full post below, please email us at support#nehcap.com [lwa][/s2If] [s2If current_user_can(access_s2member_level1)]
- USD/CAD tallies a four-day losing streak, trading at 1.3545.
The pair currently trades last at 1.35480.
The previous day high was 1.3593 while the previous day low was 1.3544. The daily 38.2% Fib levels comes at 1.3563, expected to provide resistance. Similarly, the daily 61.8% fib level is at 1.3574, expected to provide resistance.
The USD/CAD continued its downward path on Wednesday, tallied a more than 1% decline in the last four days, and traded at the 1.3585 – 1.3520 range. On the USD side, the Greenback is holding its foot after the release of inflation figures as investors are still placing bets on one last hike by the Federal Reserve (Fed) in 2023. On the other hand, the CAD trades strong, mainly driven by higher Oil prices that rose to highs since November on Tuesday.
On the data front, the US Headline Consumer Price Index (CPI) rose to 3.7%, higher than the previous 3.2% and the expected figure of 3.6%, and the US Bureau of Labor Statistics (BLS) reported that an increase in energy prices drove the rise. On a positive note, the sticky Core measure eased to 4.3% from its previous reading of 4.7%, matching the expectations.
All eyes are now on Thursday’s Produce Price Index (PPI) figures from the US, which is expected to accelerate to 1.2% YoY from its previous 0.8%. Retail sales from the same month will also be closely watched. As for now, the CME FedWatch tool indicates the case of one last 25 basis point hike by the Federal Reserve (Fed) remains strong as investors discount nearly 40% odds of possibilities. In line with that, hawkish bets may cushion the USD’s losses.
Analysing the daily chart, the technical outlook for the USD/CAD remains neutral to bearish as the bears continue to show signs of gaining ground. With a negative slope below its midline, the Relative Strength Index (RSI) signals a bearish sentiment, while the Moving Average Convergence (MACD) histogram shows increasing red bars.
Support levels: 1.3520, 1.3500, 1.3490.
Resistance levels: 1.3576 (20-day SMA), 1.3600, 1.3630.
Technical Levels: Supports and Resistances
USDCAD currently trading at 1.3546 at the time of writing. Pair opened at 1.3554 and is trading with a change of -0.06 % .
| Overview | Overview.1 | |
|---|---|---|
| 0 | Today last price | 1.3546 |
| 1 | Today Daily Change | -0.0008 |
| 2 | Today Daily Change % | -0.0600 |
| 3 | Today daily open | 1.3554 |
The pair is trading below its 20 Daily moving average @ 1.3577, above its 50 Daily moving average @ 1.3401 , above its 100 Daily moving average @ 1.3405 and above its 200 Daily moving average @ 1.3467
| Trends | Trends.1 | |
|---|---|---|
| 0 | Daily SMA20 | 1.3577 |
| 1 | Daily SMA50 | 1.3401 |
| 2 | Daily SMA100 | 1.3405 |
| 3 | Daily SMA200 | 1.3467 |
The previous day high was 1.3593 while the previous day low was 1.3544. The daily 38.2% Fib levels comes at 1.3563, expected to provide resistance. Similarly, the daily 61.8% fib level is at 1.3574, expected to provide resistance.
Note the levels of interest below:
- Pivot support is noted at 1.3534, 1.3514, 1.3484
- Pivot resistance is noted at 1.3583, 1.3613, 1.3633
| Levels | Levels.1 |
|---|---|
| Previous Daily High | 1.3593 |
| Previous Daily Low | 1.3544 |
| Previous Weekly High | 1.3694 |
| Previous Weekly Low | 1.3576 |
| Previous Monthly High | 1.3640 |
| Previous Monthly Low | 1.3184 |
| Daily Fibonacci 38.2% | 1.3563 |
| Daily Fibonacci 61.8% | 1.3574 |
| Daily Pivot Point S1 | 1.3534 |
| Daily Pivot Point S2 | 1.3514 |
| Daily Pivot Point S3 | 1.3484 |
| Daily Pivot Point R1 | 1.3583 |
| Daily Pivot Point R2 | 1.3613 |
| Daily Pivot Point R3 | 1.3633 |
[/s2If]
Download Nehcap EAWe have two EAs that are operational on our LIVE accounts.
- EA-FIX: Check out the details here. Download EA-FIX . EA-FIX is a non-grid HFT scalper.
- EA-GROWTH: High quality low dd EA using trend grids. Download EA_GROWTHJoin Our Telegram Group
")


