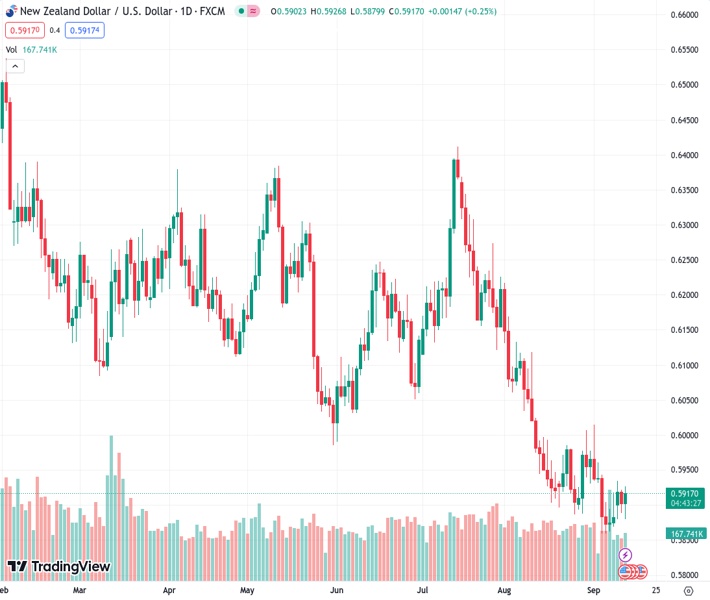
The New Zealand dollar to US dollar exchange rate, currently at 0.59161, has experienced a 0.30% increase and has reached the level of 0.5915.
…
This is a premium post.
[s2If !current_user_can(access_s2member_level4)]Please register for FREE REGISTER to read full post below containing analysis. In case of any error or you think you are not able to read the full post below, please email us at support#nehcap.com [lwa][/s2If] [s2If current_user_can(access_s2member_level1)]
- NZD/USD is seeing 0.30% gaina and rose to 0.5915.
The pair currently trades last at 0.59161.
The previous day high was 0.5931 while the previous day low was 0.5889. The daily 38.2% Fib levels comes at 0.5905, expected to provide support. Similarly, the daily 61.8% fib level is at 0.5915, expected to provide support.
In Wednesday’s session, the NZD/USD increased towards 0.5915, near the 20-day SMA of 0.5922. That being said, the upside potential during the session is limited by the US Dollar holding its foot after the release of hot inflation readings from the US.
In August, the US saw a surge in inflation, with the Consumer Price Index (CPI) increasing by 3.7% YoY, up from 3.2% in July, according to the US Bureau of Labor Statistics (BLS). This exceeded market expectations of 3.6%, while the monthly figure matched forecasts at 0.6%. The core annual reading eased to 4.3% from July’s 4.7%, matching expectations.
The initial reaction was a spike of the US 2-year Treasury yield to 5.08%, it highest in over two weeks, and then consolidated near 5%. The 5 and 10-year rates saw similar movements and are consolidating at 4.41% and 4.28%. In line with that, yields remain high as, according to the CME FedWatch tool, markets still price in high odds of one last hike in November or December by the Federal Reserve (Fed).
Attention now shifts to Thursday’s Producer Price Index (PPI) figures from August from the US, which will guide investors in modelling their expectations for the next Fed meetings.
The NZD/USD daily chart analysis points to a bearish sentiment for the short term. The Relative Strength Index (RSI) is situated below its midline while the Moving Average Convergence Divergence (MACD) prints flat green bars, signifying that despite gaining some traction, the bull’s momentum is still weak. Additionally, the pair is below the 20,100 and 200-day Simple Moving Averages (SMAs), indicating that the bears are still in command on the broader picture.
Supports: 0.5900, 0.5890, 0.5850.
Resistances: 0.5922 (20-day SMA), 0.5930, 0.5960.
Technical Levels: Supports and Resistances
NZDUSD currently trading at 0.5916 at the time of writing. Pair opened at 0.5904 and is trading with a change of 0.2 % .
| Overview | Overview.1 | |
|---|---|---|
| 0 | Today last price | 0.5916 |
| 1 | Today Daily Change | 0.0012 |
| 2 | Today Daily Change % | 0.2000 |
| 3 | Today daily open | 0.5904 |
The pair remains strongly bearish on the daily time frame. It trades below the 20 SMA @ 0.5925, 50 SMA 0.607, 100 SMA @ 0.6119 and 200 SMA @ 0.6207.
| Trends | Trends.1 | |
|---|---|---|
| 0 | Daily SMA20 | 0.5925 |
| 1 | Daily SMA50 | 0.6070 |
| 2 | Daily SMA100 | 0.6119 |
| 3 | Daily SMA200 | 0.6207 |
The previous day high was 0.5931 while the previous day low was 0.5889. The daily 38.2% Fib levels comes at 0.5905, expected to provide support. Similarly, the daily 61.8% fib level is at 0.5915, expected to provide support.
Note the levels of interest below:
- Pivot support is noted at 0.5885, 0.5866, 0.5843
- Pivot resistance is noted at 0.5927, 0.595, 0.5969
| Levels | Levels.1 |
|---|---|
| Previous Daily High | 0.5931 |
| Previous Daily Low | 0.5889 |
| Previous Weekly High | 0.5961 |
| Previous Weekly Low | 0.5847 |
| Previous Monthly High | 0.6219 |
| Previous Monthly Low | 0.5885 |
| Daily Fibonacci 38.2% | 0.5905 |
| Daily Fibonacci 61.8% | 0.5915 |
| Daily Pivot Point S1 | 0.5885 |
| Daily Pivot Point S2 | 0.5866 |
| Daily Pivot Point S3 | 0.5843 |
| Daily Pivot Point R1 | 0.5927 |
| Daily Pivot Point R2 | 0.5950 |
| Daily Pivot Point R3 | 0.5969 |
[/s2If]
Download Nehcap EAWe have two EAs that are operational on our LIVE accounts.
- EA-FIX: Check out the details here. Download EA-FIX . EA-FIX is a non-grid HFT scalper.
- EA-GROWTH: High quality low dd EA using trend grids. Download EA_GROWTHJoin Our Telegram Group
")


