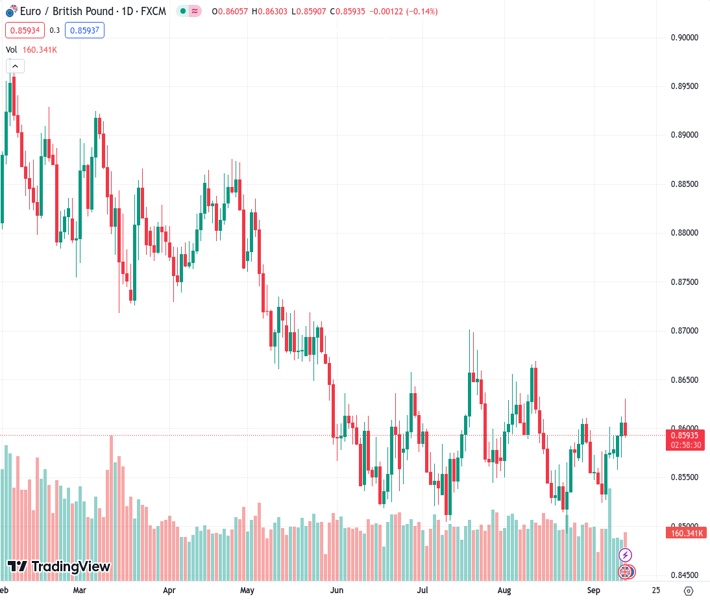
The EURGBP currency pair, currently valued at 0.85940, is now trading at 0.8595, representing a decrease of 0.12%. This decline is due to traders preparing themselves for a potential 25 basis points increase in the interest rates by the European Central Bank (ECB).
…
This is a premium post.
[s2If !current_user_can(access_s2member_level4)]Please register for FREE REGISTER to read full post below containing analysis. In case of any error or you think you are not able to read the full post below, please email us at support#nehcap.com [lwa][/s2If] [s2If current_user_can(access_s2member_level1)]
- EUR/GBP trades at 0.8595, down 0.12%, as traders position for a possible ECB rate hike of 25 basis points.
The pair currently trades last at 0.85940.
The previous day high was 0.8613 while the previous day low was 0.857. The daily 38.2% Fib levels comes at 0.8597, expected to provide resistance. Similarly, the daily 61.8% fib level is at 0.8587, expected to provide support.
The Euro (EUR) loses territory against the Pound Sterling (GBP), as traders brace for tomorrow’s European Central Bank (ECB) monetary policy decision. Despite odds the ECB would raise rates by 25 basis points, it was no excuse for EUR/GBP traders to short the pair ahead of the meeting. The cross-currency pair exchanges hands at 0.8595, down 0.12%.
The daily chart portrays the pair reaching a four-week high at 0.8630 but erased those gains and formed a tweezers-top inverted hammer, which could pave the way for further losses. But a daily close at around 0.8592 is needed to cement a downward correction. In that case, the cross-currency next support would be the 50-day Moving Average (DMA) at 0.8580, followed by the September 12 swing low of 0.8569. Upside risks emerge at the current week’s high of 0.8630.
The one-hour chart portrays the pair failed to extend its gains past the daily high and retreated below the previous higher-low of 0.8603, opening the door for further downside. The next support would be 0.8587, followed by the 200-hour Moving Average (HMA) at 0.8572. On the flip side, the EUR/GBP first resistance would be the 50-HMA at 0.8598, the 0.8600 figure, and the next swing high at 0.8616.
Technical Levels: Supports and Resistances
EURGBP currently trading at 0.8592 at the time of writing. Pair opened at 0.8613 and is trading with a change of -0.24 % .
| Overview | Overview.1 | |
|---|---|---|
| 0 | Today last price | 0.8592 |
| 1 | Today Daily Change | -0.0021 |
| 2 | Today Daily Change % | -0.2400 |
| 3 | Today daily open | 0.8613 |
The pair is trading above its 20 Daily moving average @ 0.8564, above its 50 Daily moving average @ 0.8582 , below its 100 Daily moving average @ 0.8617 and below its 200 Daily moving average @ 0.8712
| Trends | Trends.1 | |
|---|---|---|
| 0 | Daily SMA20 | 0.8564 |
| 1 | Daily SMA50 | 0.8582 |
| 2 | Daily SMA100 | 0.8617 |
| 3 | Daily SMA200 | 0.8712 |
The previous day high was 0.8613 while the previous day low was 0.857. The daily 38.2% Fib levels comes at 0.8597, expected to provide resistance. Similarly, the daily 61.8% fib level is at 0.8587, expected to provide support.
Note the levels of interest below:
- Pivot support is noted at 0.8584, 0.8556, 0.8542
- Pivot resistance is noted at 0.8627, 0.8641, 0.8669
| Levels | Levels.1 |
|---|---|
| Previous Daily High | 0.8613 |
| Previous Daily Low | 0.8570 |
| Previous Weekly High | 0.8601 |
| Previous Weekly Low | 0.8524 |
| Previous Monthly High | 0.8669 |
| Previous Monthly Low | 0.8493 |
| Daily Fibonacci 38.2% | 0.8597 |
| Daily Fibonacci 61.8% | 0.8587 |
| Daily Pivot Point S1 | 0.8584 |
| Daily Pivot Point S2 | 0.8556 |
| Daily Pivot Point S3 | 0.8542 |
| Daily Pivot Point R1 | 0.8627 |
| Daily Pivot Point R2 | 0.8641 |
| Daily Pivot Point R3 | 0.8669 |
[/s2If]
Download Nehcap EAWe have two EAs that are operational on our LIVE accounts.
- EA-FIX: Check out the details here. Download EA-FIX . EA-FIX is a non-grid HFT scalper.
- EA-GROWTH: High quality low dd EA using trend grids. Download EA_GROWTHJoin Our Telegram Group
")


