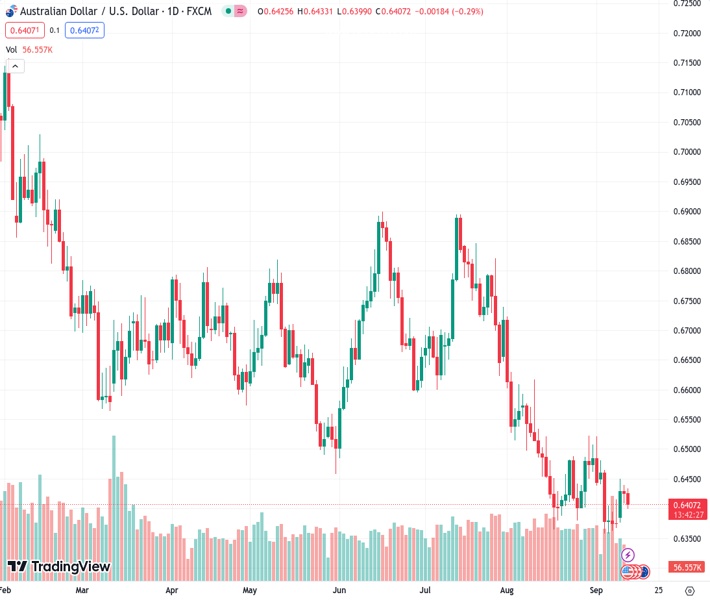
The AUD/USD pair, trading at a rate of 0.64082, continues to face downward pressure near the 0.6400 level in anticipation of the release of important US inflation data.
…
This is a premium post.
[s2If !current_user_can(access_s2member_level4)]Please register for FREE REGISTER to read full post below containing analysis. In case of any error or you think you are not able to read the full post below, please email us at support#nehcap.com [lwa][/s2If] [s2If current_user_can(access_s2member_level1)]
- AUD/USD remains under pressure around 0.6400 ahead of the US key inflation data.
The pair currently trades last at 0.64082.
The previous day high was 0.644 while the previous day low was 0.6408. The daily 38.2% Fib levels comes at 0.642, expected to provide resistance. Similarly, the daily 61.8% fib level is at 0.6428, expected to provide resistance.
The AUD/USD pair attracts some sellers and drops to the 0.6400 area during the early European trading hours on Wednesday. The pair is trading near 0.6404, losing 0.33% on the day. Markets turn cautious ahead of the highly anticipated US inflation data.
The Australian Consumer Confidence Index fell into negative territory in August, limiting the Australian dollar’s upside potential. Data released on Tuesday revealed that Australia’s Westpac Consumer Confidence for September fell by 1.5% to 79.7, following a 0.4% drop in the previous reading. The figures fueled concern about the impact of the economic slowdown in China.
Additionally, Beijing’s delayed implementation of additional stimulus measures has increased the level of concern. It’s worth noting that China is Australia’s top trading partner and the economic downturn in China might exert some selling pressure on the Aussie.
On the other hand, the US Dollar (USD) may benefit from the higher for longer interest rate narrative in the US. The August US Consumer Price Index (CPI) could provide hints about the further monetary policy from the Federal Reserve (Fed) for the rest of the year. The annual CPI figure is anticipated to rise from 3.2% to 3.6%, while the core figure is expected to fall from 4.7% to 4.3%.
Market players await the US Consumer Price Index for August due later in the day. The stronger-than-expected data might convince the Fed to hike an additional rate. Attention will shift to the Australian employment data and the US Producer Price Index (PPI) for August on Thursday. These figures could give a clear direction to the AUD/USD pair.
The AUD/USD pair trades below the 50- and 100-hour Exponential Moving Averages (EMAs) on the one-hour chart, indicating that the path of least resistance for the pair is to the downside.
Resistance level: 0.6432, 0.6500 and 0.6522
Support level: 0.6400, 0.6380 and 0.6365
Technical Levels: Supports and Resistances
AUDUSD currently trading at 0.6408 at the time of writing. Pair opened at 0.6426 and is trading with a change of -0.28 % .
| Overview | Overview.1 | |
|---|---|---|
| 0 | Today last price | 0.6408 |
| 1 | Today Daily Change | -0.0018 |
| 2 | Today Daily Change % | -0.2800 |
| 3 | Today daily open | 0.6426 |
The pair remains strongly bearish on the daily time frame. It trades below the 20 SMA @ 0.6427, 50 SMA 0.6571, 100 SMA @ 0.6622 and 200 SMA @ 0.671.
| Trends | Trends.1 | |
|---|---|---|
| 0 | Daily SMA20 | 0.6427 |
| 1 | Daily SMA50 | 0.6571 |
| 2 | Daily SMA100 | 0.6622 |
| 3 | Daily SMA200 | 0.6710 |
The previous day high was 0.644 while the previous day low was 0.6408. The daily 38.2% Fib levels comes at 0.642, expected to provide resistance. Similarly, the daily 61.8% fib level is at 0.6428, expected to provide resistance.
Note the levels of interest below:
- Pivot support is noted at 0.641, 0.6393, 0.6378
- Pivot resistance is noted at 0.6441, 0.6456, 0.6472
| Levels | Levels.1 |
|---|---|
| Previous Daily High | 0.6440 |
| Previous Daily Low | 0.6408 |
| Previous Weekly High | 0.6480 |
| Previous Weekly Low | 0.6357 |
| Previous Monthly High | 0.6724 |
| Previous Monthly Low | 0.6364 |
| Daily Fibonacci 38.2% | 0.6420 |
| Daily Fibonacci 61.8% | 0.6428 |
| Daily Pivot Point S1 | 0.6410 |
| Daily Pivot Point S2 | 0.6393 |
| Daily Pivot Point S3 | 0.6378 |
| Daily Pivot Point R1 | 0.6441 |
| Daily Pivot Point R2 | 0.6456 |
| Daily Pivot Point R3 | 0.6472 |
[/s2If]
Download Nehcap EAWe have two EAs that are operational on our LIVE accounts.
- EA-FIX: Check out the details here. Download EA-FIX . EA-FIX is a non-grid HFT scalper.
- EA-GROWTH: High quality low dd EA using trend grids. Download EA_GROWTHJoin Our Telegram Group
")


