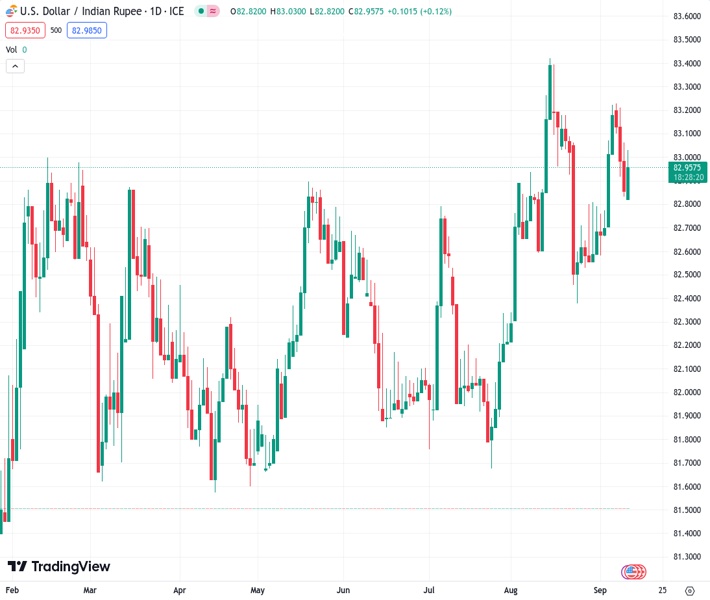
The USD to INR exchange rate is at 82.9400, indicating a slight improvement from the lowest point reached this Thursday.
…
This is a premium post.
[s2If !current_user_can(access_s2member_level4)]Please register for FREE REGISTER to read full post below containing analysis. In case of any error or you think you are not able to read the full post below, please email us at support#nehcap.com [lwa][/s2If] [s2If current_user_can(access_s2member_level1)]
- USD/INR states a modest recovery from a one-week low touched this Thursday.
The pair currently trades last at 82.9400.
The previous day high was 83.125 while the previous day low was 82.8175. The daily 38.2% Fib levels comes at 82.935, expected to provide support. Similarly, the daily 61.8% fib level is at 83.0076, expected to provide resistance.
The USD/INR pair attracts some dip-buying near the 82.80 area, or a one-week low touched during the Asian session this Tuesday and for now, seems to have snapped a three-day losing streak. Spot prices, however, remain below the 83.00 round-figure mark, the near-term bias seems tilted in favour of bullish traders.
The positive outlook is reinforced by the fact that the USD/INR pair is holding comfortably above technically significant 100-day and 200-day Simple Moving Averages (SMAs). Moreover, positive oscillators on the daily chart – though have been losing some traction – suggest that the path of least resistance for spot prices is to the upside.
A sustained strength beyond the 83.00 mark will reaffirm the constructive setup and lift the pair back towards last week’s swing high, around the 83.20-83.25 region. This is followed by the 83.45 region, or the record high touched in August, which if cleared decisively will be seen as a fresh trigger for bulls and pave the way for additional gains.
On the flip side, weakness below the 82.80-82.75 region might continue to attract some dip-buying and remain limited near the 82.40-82.30 confluence, comprising the 100-day and the 200-day SMAs. The latter should act as a pivotal point, which if broken will make the USD/INR pair vulnerable to accelerate the slide towards the 82.00 round figure.
Some follow-through selling below the July monthly swing low, around the 81.70-81.65 region, will suggest that spot prices have formed a near-term top and pave the way for a deeper corrective decline. The USD/INR pair might then weaken further towards the 81.35 intermediate support before eventually dropping towards testing sub-81.00 levels.
Technical Levels: Supports and Resistances
USDINR currently trading at 82.9182 at the time of writing. Pair opened at 82.8866 and is trading with a change of 0.04 % .
| Overview | Overview.1 | |
|---|---|---|
| 0 | Today last price | 82.9182 |
| 1 | Today Daily Change | 0.0316 |
| 2 | Today Daily Change % | 0.0400 |
| 3 | Today daily open | 82.8866 |
The pair is trading below its 20 Daily moving average @ 82.9395, above its 50 Daily moving average @ 82.6259 , above its 100 Daily moving average @ 82.4154 and above its 200 Daily moving average @ 82.3347
| Trends | Trends.1 | |
|---|---|---|
| 0 | Daily SMA20 | 82.9395 |
| 1 | Daily SMA50 | 82.6259 |
| 2 | Daily SMA100 | 82.4154 |
| 3 | Daily SMA200 | 82.3347 |
The previous day high was 83.125 while the previous day low was 82.8175. The daily 38.2% Fib levels comes at 82.935, expected to provide support. Similarly, the daily 61.8% fib level is at 83.0076, expected to provide resistance.
Note the levels of interest below:
- Pivot support is noted at 82.761, 82.6355, 82.4535
- Pivot resistance is noted at 83.0686, 83.2506, 83.3761
| Levels | Levels.1 |
|---|---|
| Previous Daily High | 83.1250 |
| Previous Daily Low | 82.8175 |
| Previous Weekly High | 83.3714 |
| Previous Weekly Low | 82.5850 |
| Previous Monthly High | 83.5505 |
| Previous Monthly Low | 82.2240 |
| Daily Fibonacci 38.2% | 82.9350 |
| Daily Fibonacci 61.8% | 83.0076 |
| Daily Pivot Point S1 | 82.7610 |
| Daily Pivot Point S2 | 82.6355 |
| Daily Pivot Point S3 | 82.4535 |
| Daily Pivot Point R1 | 83.0686 |
| Daily Pivot Point R2 | 83.2506 |
| Daily Pivot Point R3 | 83.3761 |
[/s2If]
Download Nehcap EAWe have two EAs that are operational on our LIVE accounts.
- EA-FIX: Check out the details here. Download EA-FIX . EA-FIX is a non-grid HFT scalper.
- EA-GROWTH: High quality low dd EA using trend grids. Download EA_GROWTHJoin Our Telegram Group
")


