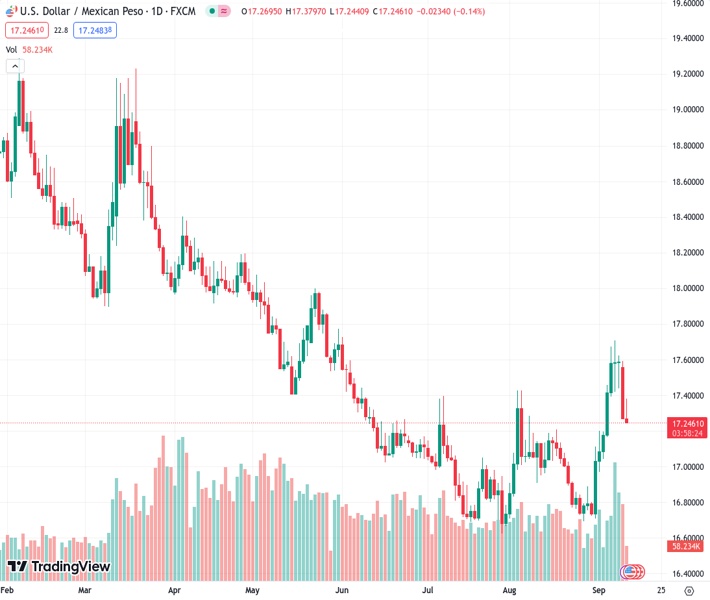
The US dollar to Mexican peso exchange rate is currently at 17.2607, with a 0.20% increase in the value of the dollar due to market concerns and a preference for lower-risk investments.
…
This is a premium post.
[s2If !current_user_can(access_s2member_level4)]Please register for FREE REGISTER to read full post below containing analysis. In case of any error or you think you are not able to read the full post below, please email us at support#nehcap.com [lwa][/s2If] [s2If current_user_can(access_s2member_level1)]
- USD/MXN trades at 17.2607, with the dollar gaining 0.20% as risk-off sentiment prevails in the market.
The pair currently trades last at 17.2497.
The previous day high was 17.5959 while the previous day low was 17.2722. The daily 38.2% Fib levels comes at 17.3959, expected to provide resistance. Similarly, the daily 61.8% fib level is at 17.4723, expected to provide resistance.
The Mexican Peso (MXN) loses some ground vs. the US Dollar (USD) after strengthening to 17.2688, but the latter regains some composure as the North American session progresses. A scarce economic docket in the US and a risk-off impulse keep investors seeking safety ahead of US inflation data. The USD/MXN is trading at 17.2607.
Risk aversion is boosting the Greenback vs. the Mexican Peso, as US equities remain trading with losses, except for the Dow Jones. Market participants are bracing for the release of August’s inflation data in the US on Wednesday. The Consumer Price Index (CPI) is expected to rise from 3.2% to 3.6% YoY, while core CPI will drop from 4.7% to 4.3%.
Ahead of the data, the buck is printing gains of 0.20%, as shown by the US Dollar Index (DXY), which tracks the American Dollar’s performance against six counterparts. The DXY is at 104.74, underpinned by the advancement of the US 2-year Treasury note yield, peaking at 5.00%.
A risk-off impulse and firm US Treasury bond yields are backing the US Dollar (USD) ahead of the release of August inflation data in the United States. The US 10-year benchmark note sits at 4.292%, unchanged compared to yesterday, contrary to the American Dollar (USD), as shown by the US Dollar Index (DXY). The DXY tracks the buck’s performance against a basket of six peers and prints solid gains of 0.30% at 104.83 after dropping to a four-day low of 104.42.
On the US front, the US Bureau of Labor Statistics (BLS) will release August’s inflation data on Wednesday. The Consumer Price Index (CPI) is expected to jump from 3.2% to 3.6% YoY, while core CPI will drop from 4.7% to 4.3%. A higher-than-expected inflation reading would reignite speculations about another rate hike by the US Federal Reserve.
Across the border, the economic package in Mexico for 2024 proposes an increase in the fiscal deficit from 3.3% to 4.9% of GDP in 2023, the most significant negative balance in 36 years. The budget assumes the USD/MXN exchange rate would average 17.60 by the end of 2025 while considering the Mexican oil exports would be selling at around $56.7 per barrel next year.
Given the fundamental backdrop, the USD/MXN would likely continue to edge lower unless tomorrow’s CPI data rises above estimates and put another interest rate increase into the table. Otherwise, expect further Mexican Peso strength, which could drive the pair back towards the 17.0000 barrier.
From a daily chart perspective, the pair is challenging technical support at the 100-day Moving Average (DMA) at 17.2558, which capped the USD/MXN drop. A daily close below the latter, and the pair could test the 20-DMA at 17.0929 before slumping toward the psychological 17.0000 price level. For an upward resumption, the exotic pair must reclaim the 17.5000 area before testing the September 11 high at 17.5927.
Technical Levels: Supports and Resistances
USDMXN currently trading at 17.2527 at the time of writing. Pair opened at 17.2748 and is trading with a change of -0.13 % .
| Overview | Overview.1 | |
|---|---|---|
| 0 | Today last price | 17.2527 |
| 1 | Today Daily Change | -0.0221 |
| 2 | Today Daily Change % | -0.1300 |
| 3 | Today daily open | 17.2748 |
The pair is trading above its 20 Daily moving average @ 17.0924, above its 50 Daily moving average @ 17.0123 , below its 100 Daily moving average @ 17.2702 and below its 200 Daily moving average @ 18.0075
| Trends | Trends.1 | |
|---|---|---|
| 0 | Daily SMA20 | 17.0924 |
| 1 | Daily SMA50 | 17.0123 |
| 2 | Daily SMA100 | 17.2702 |
| 3 | Daily SMA200 | 18.0075 |
The previous day high was 17.5959 while the previous day low was 17.2722. The daily 38.2% Fib levels comes at 17.3959, expected to provide resistance. Similarly, the daily 61.8% fib level is at 17.4723, expected to provide resistance.
Note the levels of interest below:
- Pivot support is noted at 17.1661, 17.0573, 16.8424
- Pivot resistance is noted at 17.4898, 17.7047, 17.8135
| Levels | Levels.1 |
|---|---|
| Previous Daily High | 17.5959 |
| Previous Daily Low | 17.2722 |
| Previous Weekly High | 17.7094 |
| Previous Weekly Low | 17.0447 |
| Previous Monthly High | 17.4274 |
| Previous Monthly Low | 16.6945 |
| Daily Fibonacci 38.2% | 17.3959 |
| Daily Fibonacci 61.8% | 17.4723 |
| Daily Pivot Point S1 | 17.1661 |
| Daily Pivot Point S2 | 17.0573 |
| Daily Pivot Point S3 | 16.8424 |
| Daily Pivot Point R1 | 17.4898 |
| Daily Pivot Point R2 | 17.7047 |
| Daily Pivot Point R3 | 17.8135 |
[/s2If]
Download Nehcap EAWe have two EAs that are operational on our LIVE accounts.
- EA-FIX: Check out the details here. Download EA-FIX . EA-FIX is a non-grid HFT scalper.
- EA-GROWTH: High quality low dd EA using trend grids. Download EA_GROWTHJoin Our Telegram Group
")


