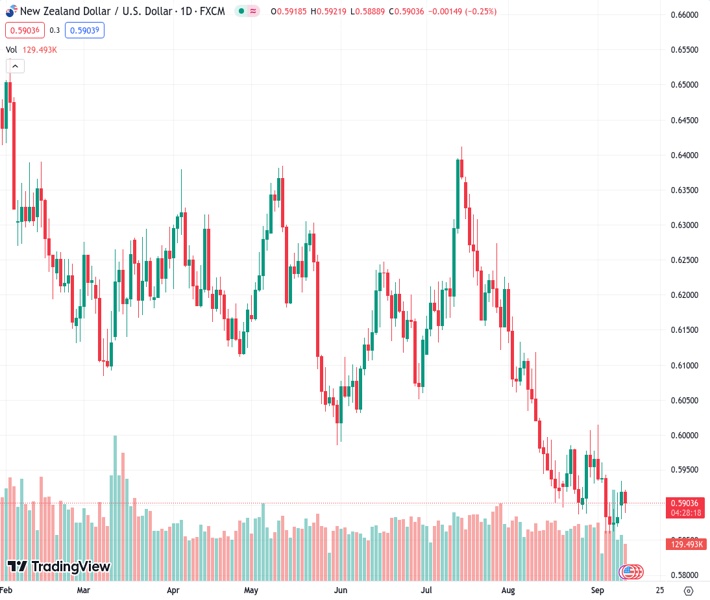
The NZDUSD pair is stuck around the 0.5900 level, lacking the ability to build any significant momentum.
…
This is a premium post.
[s2If !current_user_can(access_s2member_level4)]Please register for FREE REGISTER to read full post below containing analysis. In case of any error or you think you are not able to read the full post below, please email us at support#nehcap.com [lwa][/s2If] [s2If current_user_can(access_s2member_level1)]
- The NZD/USD is swamped near 0.5900, unable to develop meaningful momentum.
The pair currently trades last at 0.59051.
The previous day high was 0.5936 while the previous day low was 0.5884. The daily 38.2% Fib levels comes at 0.5916, expected to provide resistance. Similarly, the daily 61.8% fib level is at 0.5904, expected to provide support.
The NZD/USD pair is struggling to find firmer footing after slipping to the 0.5900 level through Tuesday’s market session, dipping from the day’s high of 0.5923 as the US Dollar (USD) takes a step higher against the Kiwi (NZD).
It’s strictly a low-impact showing for the NZD on the economic calendar this week. Food Price Index and Business Purchasing Manager Index (PMI) figures are not expected to draw much market reaction, and it will be up to the Greenback (USD) side of things to push momentum.
Investors are looking forward to the US Consumer Price Index (CPI) figures due on Wednesday. Market participants broadly believe that the Federal Reserve (Fed) will pause on further rate hikes at their upcoming meeting in September, however, expectations could swing if the CPI print surprises to the upside. Investors expect the CPI for August to show a 0.5% annualized rise in prices, mostly in the cost of energy and fuel, with the core CPI forecast to hold steady at 0.2%.
Over the weekend, US Treasury Secretary Janet Yellen declared her optimism that the US could successfully control inflation without any damage to the employment market. Yellen also noted that inflation indicators across the board have been declining recently, and there has yet to be any sign of a wave of layoffs.
The Kiwi is mostly flat on the week’s opening prices near 0.5900, but the NZD/USD pair is notably on the downside of recent action, having closed in the red for seven of the last eight consecutive trading weeks. Kiwi bulls are struggling to lift the pair from the year’s lows near 0.5860, and sustained selling pressure will send the NZD tumbling back to 2022’s lows near the 0.5600 handle.
Hourly candles have the pair trying to build a rally from the day’s lows near 0.5890, but 0.5900 appears to be a significant level to overcome, with 0.5980 waiting further above and acting as a ceiling for near-term momentum.
The 4-hour candle overview shows the NZD/USD pairing on the low end, struggling to hold onto near-term consolidation levels. Despite the bearish stance, higher lows are marked in for September, and Kiwi bidders will be looking to build up enough momentum to grab ahold of the 0.6000 handle.
Technical Levels: Supports and Resistances
NZDUSD currently trading at 0.5906 at the time of writing. Pair opened at 0.592 and is trading with a change of -0.24 % .
| Overview | Overview.1 | |
|---|---|---|
| 0 | Today last price | 0.5906 |
| 1 | Today Daily Change | -0.0014 |
| 2 | Today Daily Change % | -0.2400 |
| 3 | Today daily open | 0.5920 |
The pair remains strongly bearish on the daily time frame. It trades below the 20 SMA @ 0.5927, 50 SMA 0.6076, 100 SMA @ 0.6121 and 200 SMA @ 0.6209.
| Trends | Trends.1 | |
|---|---|---|
| 0 | Daily SMA20 | 0.5927 |
| 1 | Daily SMA50 | 0.6076 |
| 2 | Daily SMA100 | 0.6121 |
| 3 | Daily SMA200 | 0.6209 |
The previous day high was 0.5936 while the previous day low was 0.5884. The daily 38.2% Fib levels comes at 0.5916, expected to provide resistance. Similarly, the daily 61.8% fib level is at 0.5904, expected to provide support.
Note the levels of interest below:
- Pivot support is noted at 0.589, 0.5861, 0.5838
- Pivot resistance is noted at 0.5942, 0.5965, 0.5994
| Levels | Levels.1 |
|---|---|
| Previous Daily High | 0.5936 |
| Previous Daily Low | 0.5884 |
| Previous Weekly High | 0.5961 |
| Previous Weekly Low | 0.5847 |
| Previous Monthly High | 0.6219 |
| Previous Monthly Low | 0.5885 |
| Daily Fibonacci 38.2% | 0.5916 |
| Daily Fibonacci 61.8% | 0.5904 |
| Daily Pivot Point S1 | 0.5890 |
| Daily Pivot Point S2 | 0.5861 |
| Daily Pivot Point S3 | 0.5838 |
| Daily Pivot Point R1 | 0.5942 |
| Daily Pivot Point R2 | 0.5965 |
| Daily Pivot Point R3 | 0.5994 |
[/s2If]
Download Nehcap EAWe have two EAs that are operational on our LIVE accounts.
- EA-FIX: Check out the details here. Download EA-FIX . EA-FIX is a non-grid HFT scalper.
- EA-GROWTH: High quality low dd EA using trend grids. Download EA_GROWTHJoin Our Telegram Group
")


