The GBPUSD pair slightly decreases during the Asian trading session but does not experience significant ongoing selling pressure.
…
This is a premium post.
[s2If !current_user_can(access_s2member_level4)]Please register for FREE REGISTER to read full post below containing analysis. In case of any error or you think you are not able to read the full post below, please email us at support#nehcap.com [lwa][/s2If] [s2If current_user_can(access_s2member_level1)]
- GBP/USD ticks lower during the Asian session, albeit lacks follow-through selling.
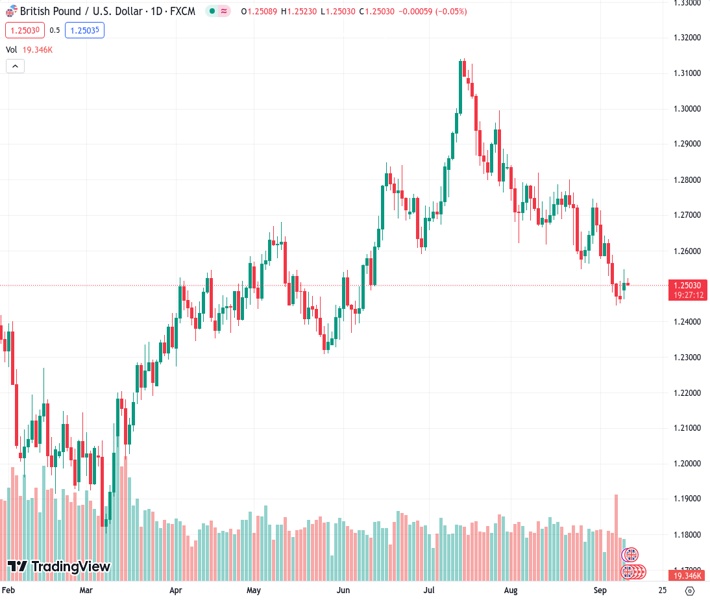
The pair currently trades last at 1.25047.
The previous day high was 1.2548 while the previous day low was 1.2466. The daily 38.2% Fib levels comes at 1.2517, expected to provide resistance. Similarly, the daily 61.8% fib level is at 1.2498, expected to provide support.
The GBP/USD pair extends the previous day’s late pullback from the vicinity of mid-1.2500s and ticks lower during the Asian session on Tuesday. Spot prices currently trade around the 1.2500 psychological mark and remain well within the striking distance of a three-month low touched last week.
The US Dollar (USD) attracts some dip-buying and reverses a part of the overnight sharp downfall, stalling its retracement slide from the highest level since March, which, in turn, is seen weighing on the GBP/USD pair. Growing acceptance that the Federal Reserve (Fed) will keep interest rates higher for longer, along with the prevalent cautious market mood, seems to benefit the safe-haven Greenback.
It is worth recalling that the markets have been pricing in the possibility of one more 25 bps Fed rate hike move by the end of this year. The bets were reaffirmed by the upbeat US macro data released last week, which pointed to a resilient economy. Moreover, The Wall Street Journal reported over the weekend that some officials still prefer to err on the side of raising rates too much, reasoning that they can cut them later.
The hawkish outlook remains supportive of elevated US Treasury bond yields and continues to fuel worries about economic headwinds stemming from rapidly rising borrowing costs. This, in turn, tempers investors’ appetite for riskier assets and drives some haven flows towards the buck. That said, Monday’s hawkish remarks by Bank of England (BoE) policymaker Catherine Mann could limit the downside for the GBP/USD pair.
Mann said that it was too soon for the BoE to stop raising interest rates and that it was better for the central bank to err on the side of raising them too high rather than stopping prematurely. This comes after BoE Governor Andrew Bailey warned last week that borrowing costs might still have further to rise because of stubbornly high inflation. Bailey, however, told lawmakers that the BoE is much nearer to ending its run of rate increases.
The mixed fundamental backdrop, meanwhile, might hold back traders from placing aggressive directional bets around the GBP/USD pair ahead of the US jobs report, due later during the early European session. The focus will then shift to the monthly UK GDP report on Wednesday, which will be followed by the release of the crucial US consumer inflation figures and provide some meaningful impetus to the major.
Technical Levels: Supports and Resistances
GBPUSD currently trading at 1.2515 at the time of writing. Pair opened at 1.251 and is trading with a change of 0.04 % .
| Overview | Overview.1 | |
|---|---|---|
| 0 | Today last price | 1.2515 |
| 1 | Today Daily Change | 0.0005 |
| 2 | Today Daily Change % | 0.0400 |
| 3 | Today daily open | 1.2510 |
The pair is trading below its 20 Daily moving average @ 1.2635, below its 50 Daily moving average @ 1.2757 , below its 100 Daily moving average @ 1.2655 and above its 200 Daily moving average @ 1.2428
| Trends | Trends.1 | |
|---|---|---|
| 0 | Daily SMA20 | 1.2635 |
| 1 | Daily SMA50 | 1.2757 |
| 2 | Daily SMA100 | 1.2655 |
| 3 | Daily SMA200 | 1.2428 |
The previous day high was 1.2548 while the previous day low was 1.2466. The daily 38.2% Fib levels comes at 1.2517, expected to provide resistance. Similarly, the daily 61.8% fib level is at 1.2498, expected to provide support.
Note the levels of interest below:
- Pivot support is noted at 1.2468, 1.2426, 1.2386
- Pivot resistance is noted at 1.255, 1.259, 1.2633
| Levels | Levels.1 |
|---|---|
| Previous Daily High | 1.2548 |
| Previous Daily Low | 1.2466 |
| Previous Weekly High | 1.2643 |
| Previous Weekly Low | 1.2446 |
| Previous Monthly High | 1.2841 |
| Previous Monthly Low | 1.2548 |
| Daily Fibonacci 38.2% | 1.2517 |
| Daily Fibonacci 61.8% | 1.2498 |
| Daily Pivot Point S1 | 1.2468 |
| Daily Pivot Point S2 | 1.2426 |
| Daily Pivot Point S3 | 1.2386 |
| Daily Pivot Point R1 | 1.2550 |
| Daily Pivot Point R2 | 1.2590 |
| Daily Pivot Point R3 | 1.2633 |
[/s2If]
Download Nehcap EAWe have two EAs that are operational on our LIVE accounts.
- EA-FIX: Check out the details here. Download EA-FIX . EA-FIX is a non-grid HFT scalper.
- EA-GROWTH: High quality low dd EA using trend grids. Download EA_GROWTHJoin Our Telegram Group
")


