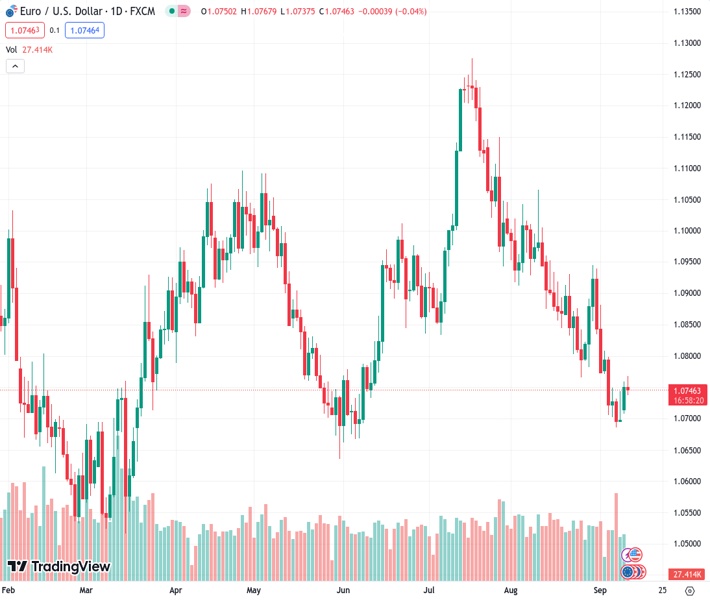
The EUR/USD currency pair is currently trading at 1.07462 and remains just below the key psychological level of 1.0750. It is expected to continue its upward movement and accumulate further gains.
…
This is a premium post.
[s2If !current_user_can(access_s2member_level4)]Please register for FREE REGISTER to read full post below containing analysis. In case of any error or you think you are not able to read the full post below, please email us at support#nehcap.com [lwa][/s2If] [s2If current_user_can(access_s2member_level1)]
- EUR/USD treads waters below the 1.0750 psychological level to extend gains.
The pair currently trades last at 1.07462.
The previous day high was 1.0759 while the previous day low was 1.0701. The daily 38.2% Fib levels comes at 1.0737, expected to provide support. Similarly, the daily 61.8% fib level is at 1.0723, expected to provide support.
EUR/USD struggles to continue the winning streak with a mild negative bias, trading around the 1.0740 aligned to the 1.0750 psychological level. The pair experienced upward support due to a pullback in the US Dollar (USD).
However, investors generally expect the ECB to adopt a dovish stance and keep interest rates unchanged at the policy meeting on Thursday. Nevertheless, it’s important to note that any unexpected or surprising actions or statements from the ECB could still have the potential to unsettle the markets and introduce a level of uncertainty about the EUR/USD pair’s trajectory.
The Moving Average Convergence Divergence (MACD) line remains below the centerline but shows convergence below the signal line. This configuration indicates that the recent market momentum is relatively weak and moves sideways.
The pair may encounter initial support around the 1.0700 psychological level followed by the previous week’s low at 1.0685. A break below the level could push the EUR/USD traders to navigate the area around June’s low at 1.0661, followed by the 1.0650 psychological level.
On the upside, a significant resistance level for the EUR/USD pair is represented by the nine-day Exponential Moving Average (EMA) at 1.0756, following the 1.0800 psychological level.
If the pair manages to break convincingly above this level, it could potentially open the door for further upward movement to explore the region around 21-day EMA at 1.0811 aligned to 23.6% Fibonacci retracement at 1.0826 level.
In the short term, the EUR/USD pair is anticipated to sustain a bearish sentiment as long as the 14-day Relative Strength Index (RSI) remains below the 50 level. This implies that the pair is likely to continue experiencing downward momentum.
Technical Levels: Supports and Resistances
EURUSD currently trading at 1.0747 at the time of writing. Pair opened at 1.075 and is trading with a change of -0.03 % .
| Overview | Overview.1 | |
|---|---|---|
| 0 | Today last price | 1.0747 |
| 1 | Today Daily Change | -0.0003 |
| 2 | Today Daily Change % | -0.0300 |
| 3 | Today daily open | 1.0750 |
The pair remains strongly bearish on the daily time frame. It trades below the 20 SMA @ 1.0819, 50 SMA 1.0946, 100 SMA @ 1.0908 and 200 SMA @ 1.0825.
| Trends | Trends.1 | |
|---|---|---|
| 0 | Daily SMA20 | 1.0819 |
| 1 | Daily SMA50 | 1.0946 |
| 2 | Daily SMA100 | 1.0908 |
| 3 | Daily SMA200 | 1.0825 |
The previous day high was 1.0759 while the previous day low was 1.0701. The daily 38.2% Fib levels comes at 1.0737, expected to provide support. Similarly, the daily 61.8% fib level is at 1.0723, expected to provide support.
Note the levels of interest below:
- Pivot support is noted at 1.0714, 1.0678, 1.0656
- Pivot resistance is noted at 1.0773, 1.0795, 1.0831
| Levels | Levels.1 |
|---|---|
| Previous Daily High | 1.0759 |
| Previous Daily Low | 1.0701 |
| Previous Weekly High | 1.0809 |
| Previous Weekly Low | 1.0686 |
| Previous Monthly High | 1.1065 |
| Previous Monthly Low | 1.0766 |
| Daily Fibonacci 38.2% | 1.0737 |
| Daily Fibonacci 61.8% | 1.0723 |
| Daily Pivot Point S1 | 1.0714 |
| Daily Pivot Point S2 | 1.0678 |
| Daily Pivot Point S3 | 1.0656 |
| Daily Pivot Point R1 | 1.0773 |
| Daily Pivot Point R2 | 1.0795 |
| Daily Pivot Point R3 | 1.0831 |
[/s2If]
Download Nehcap EAWe have two EAs that are operational on our LIVE accounts.
- EA-FIX: Check out the details here. Download EA-FIX . EA-FIX is a non-grid HFT scalper.
- EA-GROWTH: High quality low dd EA using trend grids. Download EA_GROWTHJoin Our Telegram Group
")


