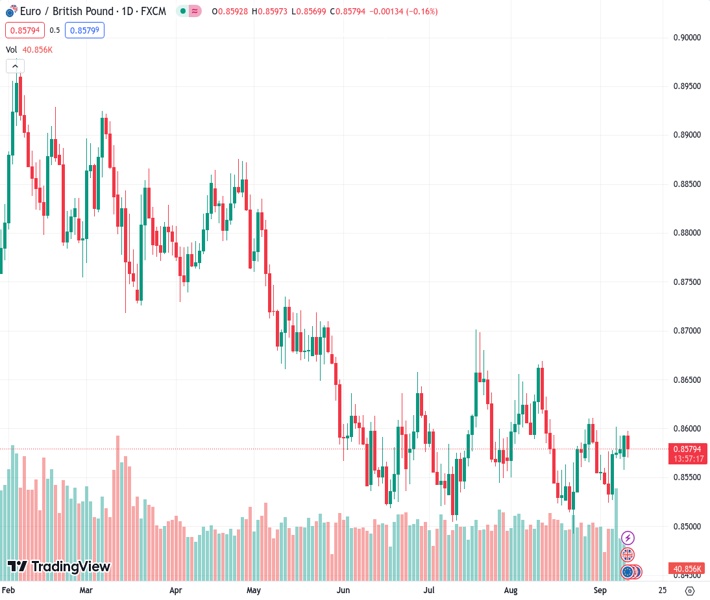
Since June, the EURGBP exchange rate has been fluctuating around 0.8580 within a downward trend channel.
…
This is a premium post.
[s2If !current_user_can(access_s2member_level4)]Please register for FREE REGISTER to read full post below containing analysis. In case of any error or you think you are not able to read the full post below, please email us at support#nehcap.com [lwa][/s2If] [s2If current_user_can(access_s2member_level1)]
- EUR/GBP hovers around 0.8580 within a descending trend channel since June.
The pair currently trades last at 0.85804.
The previous day high was 0.8594 while the previous day low was 0.8558. The daily 38.2% Fib levels comes at 0.8581, expected to provide resistance. Similarly, the daily 61.8% fib level is at 0.8572, expected to provide support.
The EUR/GBP cross holds ground around 0.8580 after bouncing off the weekly low of 0.8558 during the early European session on Tuesday. The mixed UK labor data fails to boost the Pound Sterling while investors await the monthly UK GDP report and the European Central Bank interest rate decision on Wednesday and Thursday, respectively for fresh impetus.
According to the recent data from the UK’s Office for National Statistics, the UK unemployment rate in the three months to July came in at 4.3%, from 4.2% in the previous reading and in line with market expectations. Meanwhile, Employment Change for July fell by 207K from 66K in the previous reading, worse than the 185K drop forecast. The Average Earnings Including Bonus in the three months to July rose by 8.5%, compared to 8.2% in the previous reading. The figure, excluding the bonus remains at 7.8%, as predicted.
From a technical perspective, EUR/GBP trades within a descending trend channel since the middle of June on the four-hour chart. It’s worth noting that the 50-hour EMA is on the verge of crossing above the 100-hour EMA. If a decisive crossover occurs on the four-hour chart, it would validate a Bull Cross, highlighting the path of least resistance for the cross is to the upside. Meanwhile, the Relative Strength Index (RSI) stands in bullish territory above 50, supporting the buyers for now.
The key resistance level for the cross is located at 0.8600, representing a psychological round mark and a high of August 28. The next barrier to watch is near the upper boundary of a descending trend channel at 0.8626, en route to a high of August 11 at 0.8670 and finally near a high of July 19 at 0.8700.
On the downside, the initial support level is seen at 0.8572, representing a confluence of the 50- and 100-hour EMAs. The next downside stop is located at 0.8540 (a low of September 4). Further south, the additional downside filter is located at 0.8524 (a low of September 5). The key contention will emerge at 0.8500, portraying a lower limit of a descending trend channel and a psychological figure.
Technical Levels: Supports and Resistances
EURGBP currently trading at 0.8585 at the time of writing. Pair opened at 0.8594 and is trading with a change of -0.1 % .
| Overview | Overview.1 | |
|---|---|---|
| 0 | Today last price | 0.8585 |
| 1 | Today Daily Change | -0.0009 |
| 2 | Today Daily Change % | -0.1000 |
| 3 | Today daily open | 0.8594 |
The pair is trading above its 20 Daily moving average @ 0.8563, above its 50 Daily moving average @ 0.8581 , below its 100 Daily moving average @ 0.862 and below its 200 Daily moving average @ 0.8712
| Trends | Trends.1 | |
|---|---|---|
| 0 | Daily SMA20 | 0.8563 |
| 1 | Daily SMA50 | 0.8581 |
| 2 | Daily SMA100 | 0.8620 |
| 3 | Daily SMA200 | 0.8712 |
The previous day high was 0.8594 while the previous day low was 0.8558. The daily 38.2% Fib levels comes at 0.8581, expected to provide resistance. Similarly, the daily 61.8% fib level is at 0.8572, expected to provide support.
Note the levels of interest below:
- Pivot support is noted at 0.857, 0.8546, 0.8534
- Pivot resistance is noted at 0.8606, 0.8619, 0.8643
| Levels | Levels.1 |
|---|---|
| Previous Daily High | 0.8594 |
| Previous Daily Low | 0.8558 |
| Previous Weekly High | 0.8601 |
| Previous Weekly Low | 0.8524 |
| Previous Monthly High | 0.8669 |
| Previous Monthly Low | 0.8493 |
| Daily Fibonacci 38.2% | 0.8581 |
| Daily Fibonacci 61.8% | 0.8572 |
| Daily Pivot Point S1 | 0.8570 |
| Daily Pivot Point S2 | 0.8546 |
| Daily Pivot Point S3 | 0.8534 |
| Daily Pivot Point R1 | 0.8606 |
| Daily Pivot Point R2 | 0.8619 |
| Daily Pivot Point R3 | 0.8643 |
[/s2If]
Download Nehcap EAWe have two EAs that are operational on our LIVE accounts.
- EA-FIX: Check out the details here. Download EA-FIX . EA-FIX is a non-grid HFT scalper.
- EA-GROWTH: High quality low dd EA using trend grids. Download EA_GROWTHJoin Our Telegram Group
")


