On Tuesday, the AUDUSD pair saw a slight decrease in value at a rate of 0.64297, primarily due to the increased demand for USD.
…
This is a premium post.
[s2If !current_user_can(access_s2member_level4)]Please register for FREE REGISTER to read full post below containing analysis. In case of any error or you think you are not able to read the full post below, please email us at support#nehcap.com [lwa][/s2If] [s2If current_user_can(access_s2member_level1)]
- AUD/USD edges lower on Tuesday and is pressured by the emergence of some USD buying.
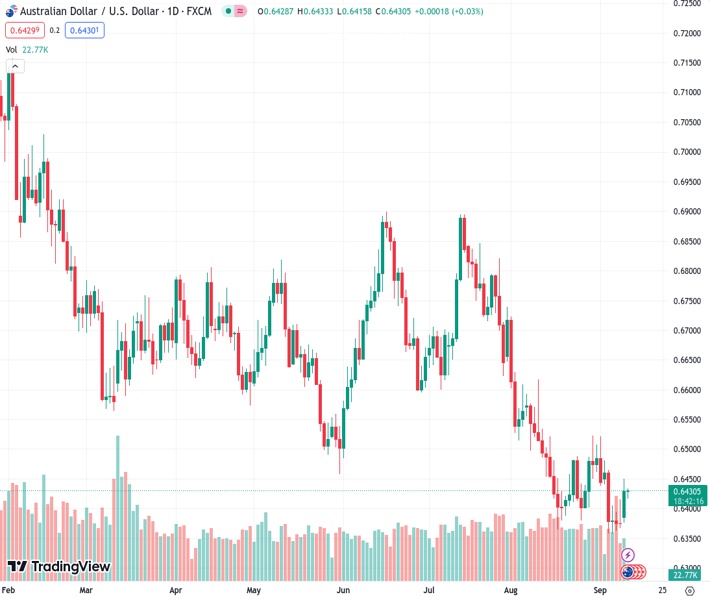
The pair currently trades last at 0.64297.
The previous day high was 0.645 while the previous day low was 0.6378. The daily 38.2% Fib levels comes at 0.6422, expected to provide support. Similarly, the daily 61.8% fib level is at 0.6405, expected to provide support.
The AUD/USD pair ticks lower during the Asian session on Tuesday and retreats further from a four-day high, around the 0.6450 area touched on Monday. Spot prices currently trade around the 0.6420-0.6415 region, down over 0.15% for the day, and remain well within the striking distance of the lowest level since November 2022 set last week.
The US Dollar (USD) attracts fresh buying following the overnight sharp decline and for now, seems to have stalled its retracement slide from a six-month peak, which, in turn, is seen as a key factor weighing on the AUD/USD pair. The prospects for further policy tightening by the Federal Reserve (Fed) remain supportive of elevated US Treasury bond yields and continue to act as a tailwind for the USD. Apart from this, the cautious market mood further benefits the Greenback’s relative safe-haven status and exerts some pressure on the risk-sensitive Australian Dollar (AUD).
The markets seem convinced that the US central bank will keep rates higher for longer and have been pricing in the possibility of one more 25 bps lift-off by the end of this year. The bets were reaffirmed by the upbeat US macro data released last week, which pointed to a resilient economy. Adding to this, The Wall Street Journal reported that some officials still prefer to err on the side of raising rates too much, reasoning that they can cut them later. This, in turn, fuels worries about economic headwinds stemming from rising borrowing costs and tempers investors’ appetite for riskier assets.
The AUD/USD pair is further undermined by the disappointing release of Australian consumer confidence data, which fell deeper into pessimistic territory during September. In fact, the Westpac – Melbourne Institute Consumer Confidence Index dropped to a dismal 79.7 for September. The gauge has been below the 100 mark since March 2022, the longest streak since the early 1990s recession. This comes on the back of growing concerns about the worsening economic conditions in China and suggests that the path of least resistance for the China-proxy Aussie is to the downside.
Traders, however, might prefer to wait on the sidelines ahead of the crucial US consumer inflation figures, due for release on Wednesday. The data will play a key role in influencing market expectations about the Fed’s future rate-hike path, which, in turn, will drive the USD demand and provide a fresh directional impetus to the AUD/USD pair.
Technical Levels: Supports and Resistances
AUDUSD currently trading at 0.6423 at the time of writing. Pair opened at 0.6435 and is trading with a change of -0.19 % .
| Overview | Overview.1 | |
|---|---|---|
| 0 | Today last price | 0.6423 |
| 1 | Today Daily Change | -0.0012 |
| 2 | Today Daily Change % | -0.1900 |
| 3 | Today daily open | 0.6435 |
The pair remains strongly bearish on the daily time frame. It trades below the 20 SMA @ 0.6428, 50 SMA 0.6576, 100 SMA @ 0.6624 and 200 SMA @ 0.6711.
| Trends | Trends.1 | |
|---|---|---|
| 0 | Daily SMA20 | 0.6428 |
| 1 | Daily SMA50 | 0.6576 |
| 2 | Daily SMA100 | 0.6624 |
| 3 | Daily SMA200 | 0.6711 |
The previous day high was 0.645 while the previous day low was 0.6378. The daily 38.2% Fib levels comes at 0.6422, expected to provide support. Similarly, the daily 61.8% fib level is at 0.6405, expected to provide support.
Note the levels of interest below:
- Pivot support is noted at 0.6392, 0.6349, 0.632
- Pivot resistance is noted at 0.6464, 0.6493, 0.6536
| Levels | Levels.1 |
|---|---|
| Previous Daily High | 0.6450 |
| Previous Daily Low | 0.6378 |
| Previous Weekly High | 0.6480 |
| Previous Weekly Low | 0.6357 |
| Previous Monthly High | 0.6724 |
| Previous Monthly Low | 0.6364 |
| Daily Fibonacci 38.2% | 0.6422 |
| Daily Fibonacci 61.8% | 0.6405 |
| Daily Pivot Point S1 | 0.6392 |
| Daily Pivot Point S2 | 0.6349 |
| Daily Pivot Point S3 | 0.6320 |
| Daily Pivot Point R1 | 0.6464 |
| Daily Pivot Point R2 | 0.6493 |
| Daily Pivot Point R3 | 0.6536 |
[/s2If]
Download Nehcap EAWe have two EAs that are operational on our LIVE accounts.
- EA-FIX: Check out the details here. Download EA-FIX . EA-FIX is a non-grid HFT scalper.
- EA-GROWTH: High quality low dd EA using trend grids. Download EA_GROWTHJoin Our Telegram Group
")


