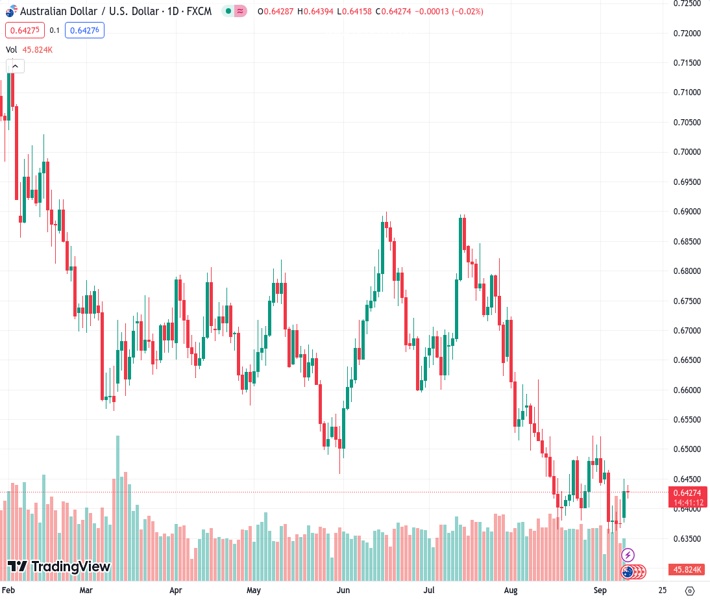
#AUDUSD at 0.64283 is facing difficulty in maintaining its recent success as a small unfavorable inclination hampers its progress.
…
This is a premium post.
[s2If !current_user_can(access_s2member_level4)]Please register for FREE REGISTER to read full post below containing analysis. In case of any error or you think you are not able to read the full post below, please email us at support#nehcap.com [lwa][/s2If] [s2If current_user_can(access_s2member_level1)]
- AUD/USD struggles to continue the winning streak due to a slight negative bias.
The pair currently trades last at 0.64283.
The previous day high was 0.645 while the previous day low was 0.6378. The daily 38.2% Fib levels comes at 0.6422, expected to provide support. Similarly, the daily 61.8% fib level is at 0.6405, expected to provide support.
AUD/USD pair struggles to extend its recent winning streak, hovering with a slight negative bias around the 0.6420 level during the Asian session on Tuesday.
The pair is experiencing downward pressure due to the release of Australia’s disappointing Westpac Consumer Confidence (Sep), which fell by 1.5% compared to the previous decline of 0.4%. However, the pullback in the US Dollar (USD) has provided the support to underpin the AUD/USD pair.
The pair may encounter initial support around 0.6400 psychological level. A firm break below the level could put pressure on the AUD/USD pair to navigate the area around the previous week’s low at 0.6357 lined up with the 0.6350 psychological level.
On the upside, a significant resistance level for the AUD/USD pair appears at the 21-day Exponential Moving Average (EMA) at 0.6448 lined up with the 0.6450 psychological level, followed by the 23.6% Fibonacci retracement at 0.6483 level.
The Moving Average Convergence Divergence (MACD) line remains below the centerline but shows divergence above the signal line. This configuration suggests a potential shift in momentum in the market, which can be seen as a signal that the recent downtrend may be losing strength, and a reversal move in the asset’s price might be on the horizon.
However, the traders of the AUD/USD pair will likely observe the 14-day Relative Strength Index (RSI), which suggests a bearish sentiment in the short term as it lies below the 50 level.
Technical Levels: Supports and Resistances
AUDUSD currently trading at 0.6424 at the time of writing. Pair opened at 0.6435 and is trading with a change of -0.17 % .
| Overview | Overview.1 | |
|---|---|---|
| 0 | Today last price | 0.6424 |
| 1 | Today Daily Change | -0.0011 |
| 2 | Today Daily Change % | -0.1700 |
| 3 | Today daily open | 0.6435 |
The pair remains strongly bearish on the daily time frame. It trades below the 20 SMA @ 0.6428, 50 SMA 0.6576, 100 SMA @ 0.6624 and 200 SMA @ 0.6711.
| Trends | Trends.1 | |
|---|---|---|
| 0 | Daily SMA20 | 0.6428 |
| 1 | Daily SMA50 | 0.6576 |
| 2 | Daily SMA100 | 0.6624 |
| 3 | Daily SMA200 | 0.6711 |
The previous day high was 0.645 while the previous day low was 0.6378. The daily 38.2% Fib levels comes at 0.6422, expected to provide support. Similarly, the daily 61.8% fib level is at 0.6405, expected to provide support.
Note the levels of interest below:
- Pivot support is noted at 0.6392, 0.6349, 0.632
- Pivot resistance is noted at 0.6464, 0.6493, 0.6536
| Levels | Levels.1 |
|---|---|
| Previous Daily High | 0.6450 |
| Previous Daily Low | 0.6378 |
| Previous Weekly High | 0.6480 |
| Previous Weekly Low | 0.6357 |
| Previous Monthly High | 0.6724 |
| Previous Monthly Low | 0.6364 |
| Daily Fibonacci 38.2% | 0.6422 |
| Daily Fibonacci 61.8% | 0.6405 |
| Daily Pivot Point S1 | 0.6392 |
| Daily Pivot Point S2 | 0.6349 |
| Daily Pivot Point S3 | 0.6320 |
| Daily Pivot Point R1 | 0.6464 |
| Daily Pivot Point R2 | 0.6493 |
| Daily Pivot Point R3 | 0.6536 |
[/s2If]
Download Nehcap EAWe have two EAs that are operational on our LIVE accounts.
- EA-FIX: Check out the details here. Download EA-FIX . EA-FIX is a non-grid HFT scalper.
- EA-GROWTH: High quality low dd EA using trend grids. Download EA_GROWTHJoin Our Telegram Group
")


