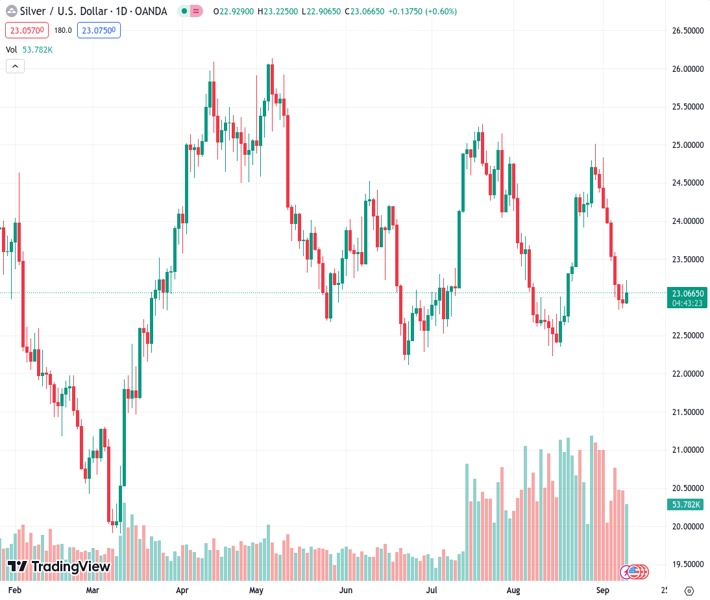
The XAGUSD pair rose above the $23.000 mark and reached a peak of $23.15 today.
…
This is a premium post.
[s2If !current_user_can(access_s2member_level4)]Please register for FREE REGISTER to read full post below containing analysis. In case of any error or you think you are not able to read the full post below, please email us at support#nehcap.com [lwa][/s2If] [s2If current_user_can(access_s2member_level1)]
- XAG/USD jumped back above $23.000 and hit a daily high of $23.15
The pair currently trades last at 23.052.
The previous day high was 23.18 while the previous day low was 22.86. The daily 38.2% Fib levels comes at 22.98, expected to provide support. Similarly, the daily 61.8% fib level is at 23.05, expected to provide support.
On Monday, precious metals are recovering ground after seeing sharp losses last week, with the Gold and Silver prices seeing daily gains. The XAG/USD stands at $23.00 and failed to maintain its momentum, which took the price to $23.15, depicting that the bears have the upperhand and limit any attempt of the buyers to make a significant upward movement.
A softer USD consolidating last week’s gains could explain the daily advance. However, US Treasury bond yields, often seen as the opportunity cost of holding non-yielding metals, are rising ahead of Wednesday’s inflation figures from the US and limiting the upside for the grey metal. Markets expect that inflation accelerated in August, with the Headline and Core Consumer Price Index (CPI) advancing by 0.5% and 0.2% MoM, respectively.
In line with this, the 10-year bond yield reached 4.29%, up by 0.87%. The 2-year yield stands neutral at 4.99%, while the 5-year yield rose to 4.42%, seeing 0.48% gains. It’s worth noticing that US yields remain high as, according to the CME FedWatch tool, markets are discounting high odds of one last hike by the Federal Reserve (Fed), and as long as hawkish bets are high, the upside potential for metals is limited.
Based on the daily chart, a bearish stance is noted for XAG/USD in the short term. The Relative Strength Index (RSI) is comfortably situated in negative territory below its midline, displaying a southward slope. In addition, the presence of red bars on the Moving Average Convergence Divergence’s (MACD) histogram further reinforces the strengthening bearish sentiment. On the other hand, the pair is below the 20,100 and 200-day Simple Moving Averages (SMAs), and cofirms the continued dominance of bears on a broader scale.
Support levels: $22.60, $22.30, $22.00
Resistance levels: $23.50 (20 and 200-day SMA convergence), $23.70, $24.00.
Technical Levels: Supports and Resistances
XAGUSD currently trading at 23.01 at the time of writing. Pair opened at 22.93 and is trading with a change of 0.35 % .
| Overview | Overview.1 | |
|---|---|---|
| 0 | Today last price | 23.01 |
| 1 | Today Daily Change | 0.08 |
| 2 | Today Daily Change % | 0.35 |
| 3 | Today daily open | 22.93 |
The pair remains strongly bearish on the daily time frame. It trades below the 20 SMA @ 23.56, 50 SMA 23.74, 100 SMA @ 23.84 and 200 SMA @ 23.47.
| Trends | Trends.1 | |
|---|---|---|
| 0 | Daily SMA20 | 23.56 |
| 1 | Daily SMA50 | 23.74 |
| 2 | Daily SMA100 | 23.84 |
| 3 | Daily SMA200 | 23.47 |
The previous day high was 23.18 while the previous day low was 22.86. The daily 38.2% Fib levels comes at 22.98, expected to provide support. Similarly, the daily 61.8% fib level is at 23.05, expected to provide support.
Note the levels of interest below:
- Pivot support is noted at 22.8, 22.67, 22.48
- Pivot resistance is noted at 23.12, 23.3, 23.44
| Levels | Levels.1 |
|---|---|
| Previous Daily High | 23.18 |
| Previous Daily Low | 22.86 |
| Previous Weekly High | 24.30 |
| Previous Weekly Low | 22.83 |
| Previous Monthly High | 25.02 |
| Previous Monthly Low | 22.23 |
| Daily Fibonacci 38.2% | 22.98 |
| Daily Fibonacci 61.8% | 23.05 |
| Daily Pivot Point S1 | 22.80 |
| Daily Pivot Point S2 | 22.67 |
| Daily Pivot Point S3 | 22.48 |
| Daily Pivot Point R1 | 23.12 |
| Daily Pivot Point R2 | 23.30 |
| Daily Pivot Point R3 | 23.44 |
[/s2If]
Download Nehcap EAWe have two EAs that are operational on our LIVE accounts.
- EA-FIX: Check out the details here. Download EA-FIX . EA-FIX is a non-grid HFT scalper.
- EA-GROWTH: High quality low dd EA using trend grids. Download EA_GROWTHJoin Our Telegram Group
")


