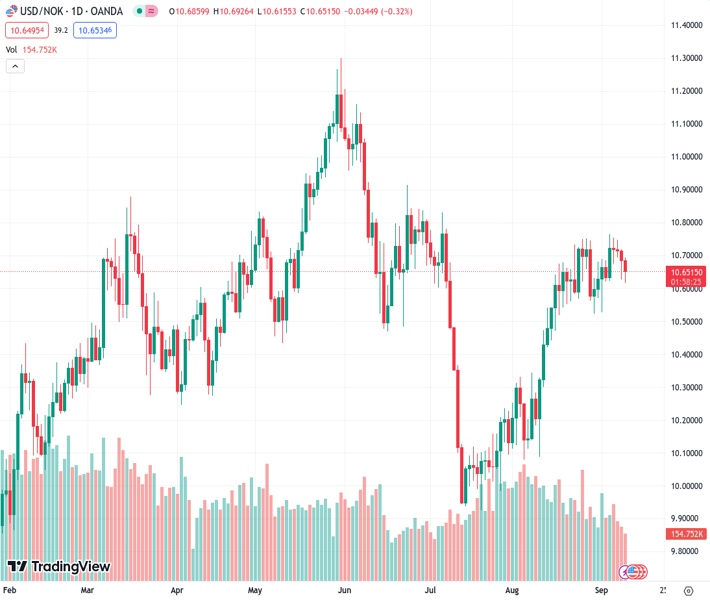
The USDNOK currency pair dropped below the 20-day Simple Moving Average (SMA) and reached around 10.6150.
…
This is a premium post.
[s2If !current_user_can(access_s2member_level4)]Please register for FREE REGISTER to read full post below containing analysis. In case of any error or you think you are not able to read the full post below, please email us at support#nehcap.com [lwa][/s2If] [s2If current_user_can(access_s2member_level1)]
- USD/NOK fell below the 20-day SMA towards the 10.6150 area.
The pair currently trades last at 10.65180.
The previous day high was 10.7194 while the previous day low was 10.6258. The daily 38.2% Fib levels comes at 10.6615, expected to provide resistance. Similarly, the daily 61.8% fib level is at 10.6837, expected to provide resistance.
At the start of the week, the USD/NOK lost the 20-day Simple Moving Average (SMA) near 10.6150 and then settled around 10.6470. Despite Norway reporting soft inflation data, the pair movements are explained by a US Dollar (USD), which is experiencing weakness across the board.
After last week’s sharp gains, the US is tallying losses against most of its rivals, including the USD, JPY, EUR and GBP, and investors seem to be taking profits. No relevant data will be released during the session, and all eyes are on Wednesday’s Consumer Price Index (CPI) from August, which is expected to have accelerated. Regarding expectations on the Federal Reserve (Fed), markets already priced in a pause in next week’s meeting. However, the odds of one last hike remain high in November and December, according to the CME FedWatch tool.
On the NOK’s side, August’s CPI from Norway came in at 4.8% YoY, lower than the expected and previous figure of 5.4%. The Norges Bank stated in its last meeting that it still has more ground to cover and will likely hike in the September meeting and a hawkish stance may provide further cushioning to the Norwegian currency.
Analysing the daily chart, it is apparent that the USD/NOK has a neutral to bearish technical stance, with the bears gradually recovering. The Relative Strength Index (RSI) points downwards in the bullish territory, suggesting a possible trend reversal, while the Moving Average Convergence (MACD) histogram presents rising red bars. Moreover, the pair is below the 20-day Simple Moving Average (SMA), but above the 100 and 200-day SMAs, indicating that the buyers still hold momentum on the bigger picture, dominating the sellers.
Support levels: 10.5900 (100-day SMA), 10.5000, 10.4000 (200-day SMA).
Resistance levels: 10.6500 (20-day SMA), 10.7000, 10.7500.
Technical Levels: Supports and Resistances
USDNOK currently trading at 10.6476 at the time of writing. Pair opened at 10.687 and is trading with a change of -0.37 % .
| Overview | Overview.1 | |
|---|---|---|
| 0 | Today last price | 10.6476 |
| 1 | Today Daily Change | -0.0394 |
| 2 | Today Daily Change % | -0.3700 |
| 3 | Today daily open | 10.6870 |
The pair remains strongly bullish on the daily timeframe. It trades above its 20 SMA @ 10.6391, 50 SMA 10.4105, 100 SMA @ 10.5977 and 200 SMA @ 10.4017.
| Trends | Trends.1 | |
|---|---|---|
| 0 | Daily SMA20 | 10.6391 |
| 1 | Daily SMA50 | 10.4105 |
| 2 | Daily SMA100 | 10.5977 |
| 3 | Daily SMA200 | 10.4017 |
The previous day high was 10.7194 while the previous day low was 10.6258. The daily 38.2% Fib levels comes at 10.6615, expected to provide resistance. Similarly, the daily 61.8% fib level is at 10.6837, expected to provide resistance.
Note the levels of interest below:
- Pivot support is noted at 10.6353, 10.5837, 10.5416
- Pivot resistance is noted at 10.729, 10.7711, 10.8227
| Levels | Levels.1 |
|---|---|
| Previous Daily High | 10.7194 |
| Previous Daily Low | 10.6258 |
| Previous Weekly High | 10.7652 |
| Previous Weekly Low | 10.6215 |
| Previous Monthly High | 10.7518 |
| Previous Monthly Low | 10.0804 |
| Daily Fibonacci 38.2% | 10.6615 |
| Daily Fibonacci 61.8% | 10.6837 |
| Daily Pivot Point S1 | 10.6353 |
| Daily Pivot Point S2 | 10.5837 |
| Daily Pivot Point S3 | 10.5416 |
| Daily Pivot Point R1 | 10.7290 |
| Daily Pivot Point R2 | 10.7711 |
| Daily Pivot Point R3 | 10.8227 |
[/s2If]
Download Nehcap EAWe have two EAs that are operational on our LIVE accounts.
- EA-FIX: Check out the details here. Download EA-FIX . EA-FIX is a non-grid HFT scalper.
- EA-GROWTH: High quality low dd EA using trend grids. Download EA_GROWTHJoin Our Telegram Group
")


