The price of XAUUSD closed above $1,920 on Monday, resulting in daily gains.
…
This is a premium post.
[s2If !current_user_can(access_s2member_level4)]Please register for FREE REGISTER to read full post below containing analysis. In case of any error or you think you are not able to read the full post below, please email us at support#nehcap.com [lwa][/s2If] [s2If current_user_can(access_s2member_level1)]
- XAU/USD secured daily gains on Monday and closed above $1,920.
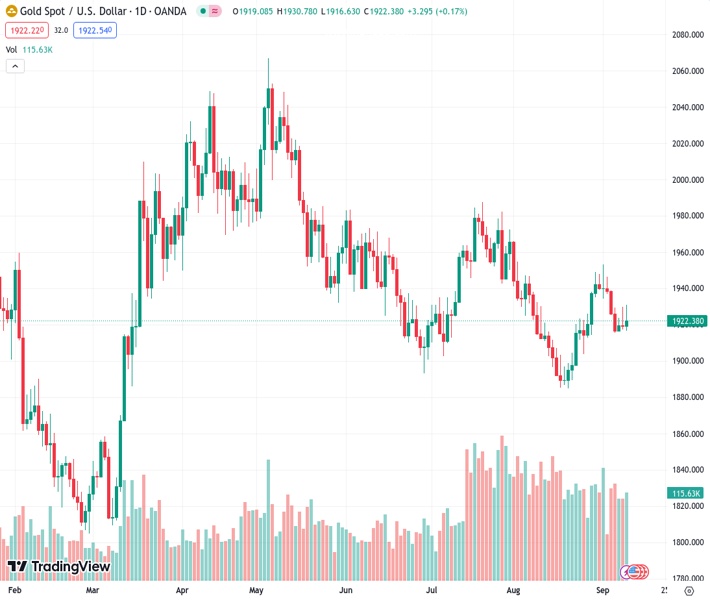
The pair currently trades last at 1922.27.
The previous day high was 1929.75 while the previous day low was 1917.41. The daily 38.2% Fib levels comes at 1922.12, expected to provide support. Similarly, the daily 61.8% fib level is at 1925.04, expected to provide resistance.
The Gold Spot price closed at $1,922 in Monday’s session, tallying a 0.18% daily increase. Thanks to weaker US Dollar, precious metals were allowed to gain some traction, but the US Treasury yields, which remain high, halted all attempts to make a significant upward movement.
On the technical front, the daily chart indicates a neutral, with a slight bullish bias in favour of the Gold’s buyers. The Relative Strength Index (RSI) displays an ascending slope in the bearish territory, hinting at a potential trend reversal of the recent bearish movements. At the same time, the Moving Average Convergence (MACD) prints lower green bars, which signifies that despite bulls gaining some ground, their momentum is relatively weak. In addition, on the bright side, the pair is holding above the 20 and 200-day Simple Moving Average (SMA) convergence at the $1,915-1,920 and as long as the buyers keep this level, the downside will be limited. However, the bulls still have more work to do and must target the 100-day SMA at $1,950 to gather momentum and continue breaking resistances. Above the 100-day average, the following targets are $1,970 and $1,990.
}
Technical Levels: Supports and Resistances
XAUUSD currently trading at 1922.42 at the time of writing. Pair opened at 1918.96 and is trading with a change of 0.18 % .
| Overview | Overview.1 | |
|---|---|---|
| 0 | Today last price | 1922.42 |
| 1 | Today Daily Change | 3.46 |
| 2 | Today Daily Change % | 0.18 |
| 3 | Today daily open | 1918.96 |
The pair is trading above its 20 Daily moving average @ 1915.98, below its 50 Daily moving average @ 1932.21 , below its 100 Daily moving average @ 1950.65 and above its 200 Daily moving average @ 1918.88
| Trends | Trends.1 | |
|---|---|---|
| 0 | Daily SMA20 | 1915.98 |
| 1 | Daily SMA50 | 1932.21 |
| 2 | Daily SMA100 | 1950.65 |
| 3 | Daily SMA200 | 1918.88 |
The previous day high was 1929.75 while the previous day low was 1917.41. The daily 38.2% Fib levels comes at 1922.12, expected to provide support. Similarly, the daily 61.8% fib level is at 1925.04, expected to provide resistance.
Note the levels of interest below:
- Pivot support is noted at 1914.33, 1909.7, 1901.99
- Pivot resistance is noted at 1926.67, 1934.38, 1939.01
| Levels | Levels.1 |
|---|---|
| Previous Daily High | 1929.75 |
| Previous Daily Low | 1917.41 |
| Previous Weekly High | 1946.35 |
| Previous Weekly Low | 1915.33 |
| Previous Monthly High | 1966.08 |
| Previous Monthly Low | 1884.85 |
| Daily Fibonacci 38.2% | 1922.12 |
| Daily Fibonacci 61.8% | 1925.04 |
| Daily Pivot Point S1 | 1914.33 |
| Daily Pivot Point S2 | 1909.70 |
| Daily Pivot Point S3 | 1901.99 |
| Daily Pivot Point R1 | 1926.67 |
| Daily Pivot Point R2 | 1934.38 |
| Daily Pivot Point R3 | 1939.01 |
[/s2If]
Download Nehcap EAWe have two EAs that are operational on our LIVE accounts.
- EA-FIX: Check out the details here. Download EA-FIX . EA-FIX is a non-grid HFT scalper.
- EA-GROWTH: High quality low dd EA using trend grids. Download EA_GROWTHJoin Our Telegram Group
")


