The NZDUSD pair increases to 0.59252 as there is a higher probability of the Federal Reserve adopting a more accommodative approach during their meeting in September.
…
This is a premium post.
[s2If !current_user_can(access_s2member_level4)]Please register for FREE REGISTER to read full post below containing analysis. In case of any error or you think you are not able to read the full post below, please email us at support#nehcap.com [lwa][/s2If] [s2If current_user_can(access_s2member_level1)]
- NZD/USD rises due to more likelihood of a dovish policy stance by the Fed in the September meeting.
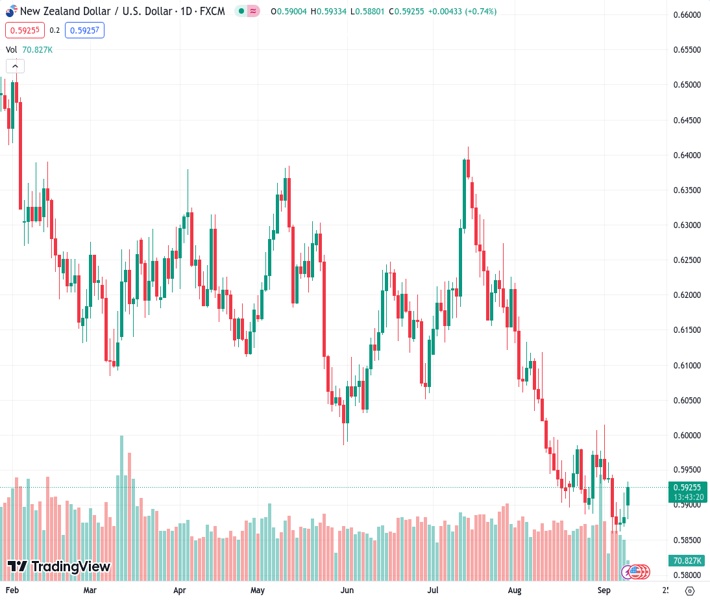
The pair currently trades last at 0.59252.
The previous day high was 0.5919 while the previous day low was 0.5847. The daily 38.2% Fib levels comes at 0.5891, expected to provide support. Similarly, the daily 61.8% fib level is at 0.5874, expected to provide support.
NZD/USD extends gains in the third trading session, trading higher around 0.5930 during the Asian session on Monday as a result of the retreat in the US Dollar (USD). This pair is experiencing upward support due to the reduced likelihood of the US Federal Reserve (Fed) maintaining unchanged interest rates in the upcoming September meeting.
The Moving Average Convergence Divergence (MACD) line remains below the centerline but is positioned above the signal line. This configuration suggests that the recent momentum in the market is relatively subdued and moving sideways.
The pair may encounter initial support at the previous week’s bottom at 0.5859 level lined up with the 0.5850 psychological level. A decisive break below this level could potentially lead to further downward movement, with Kiwi bears targeting the region near the 0.5800 psychological level.
On the upside, a significant resistance level for the NZD/USD pair is represented by the 21-day Exponential Moving Average (EMA) at 0.5947, which is closely aligned with the 0.5950 psychological level.
If the pair manages to break convincingly above this level, it could potentially open the door for further upward movement, with the next target being the region around the 23.6% Fibonacci retracement level at 0.5980.
In the near term, the NZD/USD pair is expected to maintain a bearish outlook as long as the 14-day Relative Strength Index (RSI) remains below the 50 level. This suggests a continued downward momentum in the pair.
Technical Levels: Supports and Resistances
NZDUSD currently trading at 0.5925 at the time of writing. Pair opened at 0.5883 and is trading with a change of 0.71 % .
| Overview | Overview.1 | |
|---|---|---|
| 0 | Today last price | 0.5925 |
| 1 | Today Daily Change | 0.0042 |
| 2 | Today Daily Change % | 0.7100 |
| 3 | Today daily open | 0.5883 |
The pair remains strongly bearish on the daily time frame. It trades below the 20 SMA @ 0.593, 50 SMA 0.608, 100 SMA @ 0.6123 and 200 SMA @ 0.6211.
| Trends | Trends.1 | |
|---|---|---|
| 0 | Daily SMA20 | 0.5930 |
| 1 | Daily SMA50 | 0.6080 |
| 2 | Daily SMA100 | 0.6123 |
| 3 | Daily SMA200 | 0.6211 |
The previous day high was 0.5919 while the previous day low was 0.5847. The daily 38.2% Fib levels comes at 0.5891, expected to provide support. Similarly, the daily 61.8% fib level is at 0.5874, expected to provide support.
Note the levels of interest below:
- Pivot support is noted at 0.5847, 0.5811, 0.5775
- Pivot resistance is noted at 0.5919, 0.5955, 0.5991
| Levels | Levels.1 |
|---|---|
| Previous Daily High | 0.5919 |
| Previous Daily Low | 0.5847 |
| Previous Weekly High | 0.5961 |
| Previous Weekly Low | 0.5847 |
| Previous Monthly High | 0.6219 |
| Previous Monthly Low | 0.5885 |
| Daily Fibonacci 38.2% | 0.5891 |
| Daily Fibonacci 61.8% | 0.5874 |
| Daily Pivot Point S1 | 0.5847 |
| Daily Pivot Point S2 | 0.5811 |
| Daily Pivot Point S3 | 0.5775 |
| Daily Pivot Point R1 | 0.5919 |
| Daily Pivot Point R2 | 0.5955 |
| Daily Pivot Point R3 | 0.5991 |
[/s2If]
Download Nehcap EAWe have two EAs that are operational on our LIVE accounts.
- EA-FIX: Check out the details here. Download EA-FIX . EA-FIX is a non-grid HFT scalper.
- EA-GROWTH: High quality low dd EA using trend grids. Download EA_GROWTHJoin Our Telegram Group
")


