The JPY was supported by positive Chinese economic indicators and optimistic statements made by BoJ Governor Ueda, resulting in a rise in the GBPJPY exchange rate to 183.364.
…
This is a premium post.
[s2If !current_user_can(access_s2member_level4)]Please register for FREE REGISTER to read full post below containing analysis. In case of any error or you think you are not able to read the full post below, please email us at support#nehcap.com [lwa][/s2If] [s2If current_user_can(access_s2member_level1)]
- Strong Chinese data and hawkish comments by BoJ Governor Ueda underpinned the JPY.
The pair currently trades last at 183.364.
The previous day high was 184.47 while the previous day low was 183.07. The daily 38.2% Fib levels comes at 183.93, expected to provide resistance. Similarly, the daily 61.8% fib level is at 183.6, expected to provide resistance.
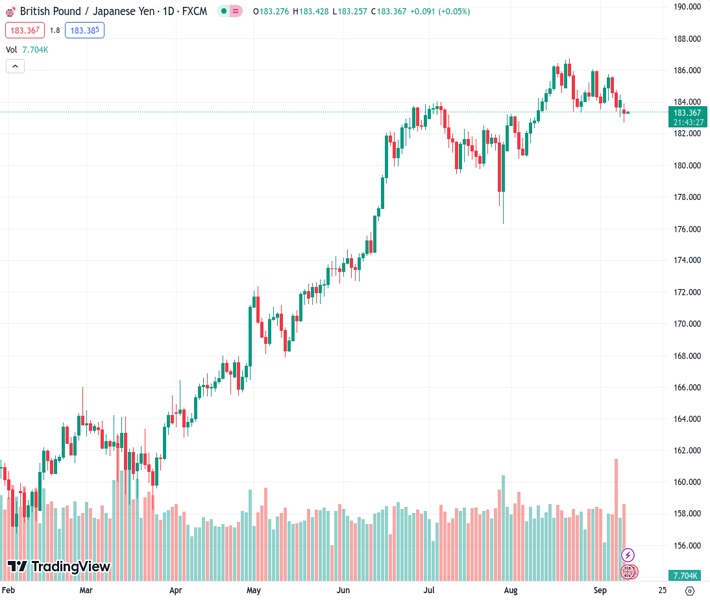
The Pound Sterling (GBP) stops its decline vs. the Japanese Yen (JPY) as Tuesday’s Asian session begins, following Monday’s session that witnessed a 0.47% loss for the cross-currency pair. The reasons behind the move were good Chinese data and some hawkish comments by the Bank of Japan (BoJ) Governor Kazuo Ueda. The GBP/JPY is trading at 183.38, a gain 0.06%.
From a daily chart perspective, the pair is neutral to upward biased, remaining above the Ichimoku Cloud (Kumo). Nevertheless, since the cross printed the yearly high, the GBP/JPY achieved successive series of lower highs and lows, keeping that neutral stance on the cross. Also, an upslope support trendline, drawn from March 2023 lows, passes around 183.00. That said, a decisive break below the latter could open the door for further downside.
Short term, the GBP/JPY is set to extend its losses, capped on the upside by the Senkou Span B at 183.57. Once cleared, the pair’s next stop would be the bottom of the Ichimoku Cloud (Kumo) at around the 183.70 area, followed by a challenge of the 184.00 figure. Conversely, and the path of least resistance, the first support would be the 183.20 area. Once cleared, the cross would dive towards the 183.00 figure, followed by the September 11 daily low at 182.67.
Technical Levels: Supports and Resistances
GBPJPY currently trading at 183.32 at the time of writing. Pair opened at 184.28 and is trading with a change of -0.52 % .
| Overview | Overview.1 | |
|---|---|---|
| 0 | Today last price | 183.32 |
| 1 | Today Daily Change | -0.96 |
| 2 | Today Daily Change % | -0.52 |
| 3 | Today daily open | 184.28 |
The pair is trading below its 20 Daily moving average @ 184.92, above its 50 Daily moving average @ 183.14 , above its 100 Daily moving average @ 178.67 and above its 200 Daily moving average @ 170.45
| Trends | Trends.1 | |
|---|---|---|
| 0 | Daily SMA20 | 184.92 |
| 1 | Daily SMA50 | 183.14 |
| 2 | Daily SMA100 | 178.67 |
| 3 | Daily SMA200 | 170.45 |
The previous day high was 184.47 while the previous day low was 183.07. The daily 38.2% Fib levels comes at 183.93, expected to provide resistance. Similarly, the daily 61.8% fib level is at 183.6, expected to provide resistance.
Note the levels of interest below:
- Pivot support is noted at 183.41, 182.54, 182.01
- Pivot resistance is noted at 184.81, 185.34, 186.21
| Levels | Levels.1 |
|---|---|
| Previous Daily High | 184.47 |
| Previous Daily Low | 183.07 |
| Previous Weekly High | 185.78 |
| Previous Weekly Low | 183.07 |
| Previous Monthly High | 186.77 |
| Previous Monthly Low | 180.46 |
| Daily Fibonacci 38.2% | 183.93 |
| Daily Fibonacci 61.8% | 183.60 |
| Daily Pivot Point S1 | 183.41 |
| Daily Pivot Point S2 | 182.54 |
| Daily Pivot Point S3 | 182.01 |
| Daily Pivot Point R1 | 184.81 |
| Daily Pivot Point R2 | 185.34 |
| Daily Pivot Point R3 | 186.21 |
[/s2If]
Download Nehcap EAWe have two EAs that are operational on our LIVE accounts.
- EA-FIX: Check out the details here. Download EA-FIX . EA-FIX is a non-grid HFT scalper.
- EA-GROWTH: High quality low dd EA using trend grids. Download EA_GROWTHJoin Our Telegram Group
")


