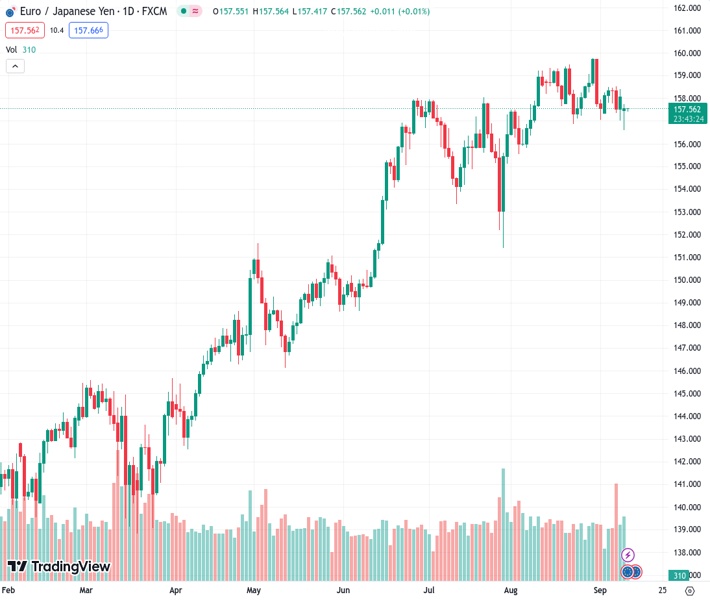
The EURJPY currency pair, which was priced at 157.509, experienced a decline and reached a low point close to 156.60. This marks its lowest level since the beginning of August.
…
This is a premium post.
[s2If !current_user_can(access_s2member_level4)]Please register for FREE REGISTER to read full post below containing analysis. In case of any error or you think you are not able to read the full post below, please email us at support#nehcap.com [lwa][/s2If] [s2If current_user_can(access_s2member_level1)]
- EUR/JPY fell to a low near 156.60, it lowest since early August.
The pair currently trades last at 157.509.
The previous day high was 158.39 while the previous day low was 157.0. The daily 38.2% Fib levels comes at 157.86, expected to provide resistance. Similarly, the daily 61.8% fib level is at 157.53, expected to provide resistance.
On Monday, the EUR/JPY traded in the 156.60 – 157.55 range. On the one hand, the Japanese Yen is trading with gains against most of its rivals, including the USD, GBP, AUD, etc., mainly driven by a rise in Japanese Government Bond yields after Bank of Japan (BoJ) comments on monetary policy. On the other hand, the Euro is trading soft as investors gear up for the European Central Bank (ECB) decision on Thursday.
The Japanese Yen is one of the top performers in the session, mainly driven by Governor Ueda’s comments during the Asian session. He pointed out that the Bank of Japan (BoJ) may gather enough evidence by the year’s end to know whether the economy is ready to pivot to a contractive monetary policy. That being said, he still believes wages and inflations are not meeting the bank’s forecasts. However, if they sustainably grow for the rest of this year, the bank would consider leaving behind the negative interest rates policy.
The 2- and 5-year JGB yields rose to their highest level since January, while the 10-year JGB rate broke above the 0.70% level.
On the EUR side, markets await the ECB’s decisions on Thursday. The expectations are mixed as the World Interest Rates Probabilities (WIRP) tool suggests that markets discount nearly 40% odds of a 25 basis point hike and analysts predict that the decision will be a close call. In addition, Lagarde’s tone and the ECB’s statement will be closely watched for investors to look for clues regarding forward guidance.
The technical analysis of the daily chart points to a neutral to bearish outlook for EUR/JPY, indicating the potential for further bearish movement. The Relative Strength Index (RSI) signals a bearish sentiment with a negative slope below its midline, while the Moving Average Convergence (MACD) histogram presents larger red bars. Furthermore, the pair is below the 20-day Simple Moving Average (SMA) but above the 100 and 200-day SMAs, indicating that the buyers still hold momentum on the bigger picture, dominating the sellers.
Support levels: 156.60, 156.00, 155.00.
Resistance levels: 157.00, 158.25 (20-day SMA), 159.00.
Technical Levels: Supports and Resistances
EURJPY currently trading at 157.52 at the time of writing. Pair opened at 158.23 and is trading with a change of -0.45 % .
| Overview | Overview.1 | |
|---|---|---|
| 0 | Today last price | 157.52 |
| 1 | Today Daily Change | -0.71 |
| 2 | Today Daily Change % | -0.45 |
| 3 | Today daily open | 158.23 |
The pair is trading below its 20 Daily moving average @ 158.35, above its 50 Daily moving average @ 157.14 , above its 100 Daily moving average @ 154.01 and above its 200 Daily moving average @ 148.4
| Trends | Trends.1 | |
|---|---|---|
| 0 | Daily SMA20 | 158.35 |
| 1 | Daily SMA50 | 157.14 |
| 2 | Daily SMA100 | 154.01 |
| 3 | Daily SMA200 | 148.40 |
The previous day high was 158.39 while the previous day low was 157.0. The daily 38.2% Fib levels comes at 157.86, expected to provide resistance. Similarly, the daily 61.8% fib level is at 157.53, expected to provide resistance.
Note the levels of interest below:
- Pivot support is noted at 157.36, 156.49, 155.97
- Pivot resistance is noted at 158.74, 159.26, 160.13
| Levels | Levels.1 |
|---|---|
| Previous Daily High | 158.39 |
| Previous Daily Low | 157.00 |
| Previous Weekly High | 158.52 |
| Previous Weekly Low | 157.00 |
| Previous Monthly High | 159.76 |
| Previous Monthly Low | 155.53 |
| Daily Fibonacci 38.2% | 157.86 |
| Daily Fibonacci 61.8% | 157.53 |
| Daily Pivot Point S1 | 157.36 |
| Daily Pivot Point S2 | 156.49 |
| Daily Pivot Point S3 | 155.97 |
| Daily Pivot Point R1 | 158.74 |
| Daily Pivot Point R2 | 159.26 |
| Daily Pivot Point R3 | 160.13 |
[/s2If]
Download Nehcap EAWe have two EAs that are operational on our LIVE accounts.
- EA-FIX: Check out the details here. Download EA-FIX . EA-FIX is a non-grid HFT scalper.
- EA-GROWTH: High quality low dd EA using trend grids. Download EA_GROWTHJoin Our Telegram Group
")


