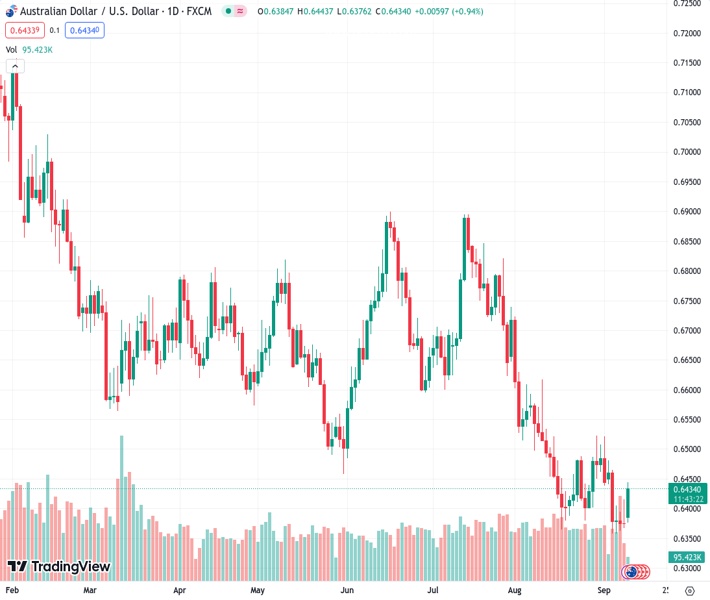
The AUDUSD currency pair experienced significant upward movement on Monday, with a strong positive trend, thanks to a notable decrease in the value of the US dollar.
…
This is a premium post.
[s2If !current_user_can(access_s2member_level4)]Please register for FREE REGISTER to read full post below containing analysis. In case of any error or you think you are not able to read the full post below, please email us at support#nehcap.com [lwa][/s2If] [s2If current_user_can(access_s2member_level1)]
- AUD/USD gains strong positive traction on Monday and is supported by a sharp USD slide.
The pair currently trades last at 0.64339.
The previous day high was 0.6415 while the previous day low was 0.6367. The daily 38.2% Fib levels comes at 0.6397, expected to provide support. Similarly, the daily 61.8% fib level is at 0.6385, expected to provide support.
The AUD/USD pair catches aggressive bids on the first day of a new week and sticks to its strong intraday gains, near a multi-day peak through the first half of the European session. Spot prices currently trade just below mid-0.6400s, up nearly 1% for the day, and draw support from a sharp US Dollar (USD) downfall.
The hawkish Bank of Japan (BoJ)-inspired strong move up in the Japanese Yen (JPY) drags the USD Index (DXY), which tracks the Greenback against a basket of currencies, away from a six-month peak touched on Friday. The USD downfall could further be attributed to some repositioning trade ahead of this week’s important US macro data, including the latest consumer inflation figures on Wednesday.
The crucial US CPI report will play a key role in influencing market expectations about the Federal Reserve’s (Fed) future rate hike path, which, in turn, will drive the USD demand and provide a fresh directional impetus to the AUD/USD pair. In the meantime, the prospects for further policy tightening by the Fed should help limit the downside for the buck and cap any further gains for the major.
In fact, market participants seem convinced that the US central bank will stick to its hawkish stance and have been pricing in the possibility of one more 25 bps lift-off by the end of this year. Furthermore, the upbeat US macro data released last week pointed to a resilient economy and should allow the Fed to keep interest rates higher for longer. This remains supportive of elevated US Treasury bond yields.
The aforementioned fundamental backdrop favours the USD bulls, though a generally positive tone around the equity markets is seen benefitting the risk-sensitive Aussie. Investors cheered the better-than-expected China inflation data released over the weekend, which showed that consumer price inflation rose back into positive territory in August and raised hopes that the economy might be stabilizing.
That said, concerns about the worsening conditions in the world’s second-largest economy and headwinds stemming from rapidly rising borrowing costs should cap any optimism in the markets. This, in turn, makes it prudent to wait for strong follow-through buying before confirming that the AUD/USD pair has formed a near-term bottom and positioning for any further appreciating move.
Technical Levels: Supports and Resistances
AUDUSD currently trading at 0.6435 at the time of writing. Pair opened at 0.6378 and is trading with a change of 0.89 % .
| Overview | Overview.1 | |
|---|---|---|
| 0 | Today last price | 0.6435 |
| 1 | Today Daily Change | 0.0057 |
| 2 | Today Daily Change % | 0.8900 |
| 3 | Today daily open | 0.6378 |
The pair is trading above its 20 Daily moving average @ 0.6431, below its 50 Daily moving average @ 0.6581 , below its 100 Daily moving average @ 0.6627 and below its 200 Daily moving average @ 0.6713
| Trends | Trends.1 | |
|---|---|---|
| 0 | Daily SMA20 | 0.6431 |
| 1 | Daily SMA50 | 0.6581 |
| 2 | Daily SMA100 | 0.6627 |
| 3 | Daily SMA200 | 0.6713 |
The previous day high was 0.6415 while the previous day low was 0.6367. The daily 38.2% Fib levels comes at 0.6397, expected to provide support. Similarly, the daily 61.8% fib level is at 0.6385, expected to provide support.
Note the levels of interest below:
- Pivot support is noted at 0.6358, 0.6339, 0.6311
- Pivot resistance is noted at 0.6406, 0.6434, 0.6453
| Levels | Levels.1 |
|---|---|
| Previous Daily High | 0.6415 |
| Previous Daily Low | 0.6367 |
| Previous Weekly High | 0.6480 |
| Previous Weekly Low | 0.6357 |
| Previous Monthly High | 0.6724 |
| Previous Monthly Low | 0.6364 |
| Daily Fibonacci 38.2% | 0.6397 |
| Daily Fibonacci 61.8% | 0.6385 |
| Daily Pivot Point S1 | 0.6358 |
| Daily Pivot Point S2 | 0.6339 |
| Daily Pivot Point S3 | 0.6311 |
| Daily Pivot Point R1 | 0.6406 |
| Daily Pivot Point R2 | 0.6434 |
| Daily Pivot Point R3 | 0.6453 |
[/s2If]
Download Nehcap EAWe have two EAs that are operational on our LIVE accounts.
- EA-FIX: Check out the details here. Download EA-FIX . EA-FIX is a non-grid HFT scalper.
- EA-GROWTH: High quality low dd EA using trend grids. Download EA_GROWTHJoin Our Telegram Group
")


