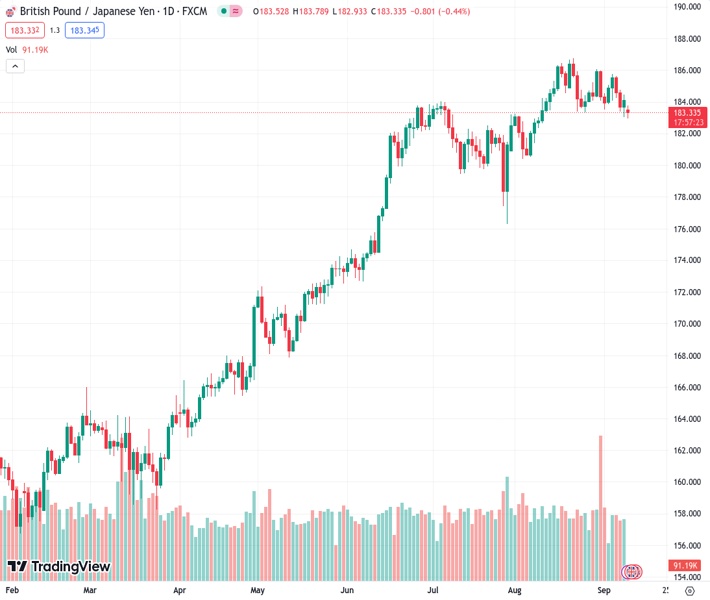
Since August, the GBPJPY currency pair has been engaging in cross trades while adhering to a descending triangle formation, with a current value at 183.309.
…
This is a premium post.
[s2If !current_user_can(access_s2member_level4)]Please register for FREE REGISTER to read full post below containing analysis. In case of any error or you think you are not able to read the full post below, please email us at support#nehcap.com [lwa][/s2If] [s2If current_user_can(access_s2member_level1)]
- GBP/JPY cross trades within the descending triangle pattern since August.
The pair currently trades last at 183.309.
The previous day high was 184.47 while the previous day low was 183.07. The daily 38.2% Fib levels comes at 183.93, expected to provide resistance. Similarly, the daily 61.8% fib level is at 183.6, expected to provide resistance.
The GBP/JPY cross trades within the descending triangle pattern since August. The cross currently trades around 183.22, losing 0.56% on the day. The recent interview of the Japanese policymaker triggers the Japanese Yen (JPY) higher against the British Pound (GBP) in the early Asian session on Monday. Bank of Japan (BoJ) Governor Kazuo Ueda stated in an interview on Monday that the central bank will now be on “a quiet exit,” as the BOJ seeks to avoid any major impact on the market.
From the technical perspective, the GBP/JPY cross stands below the 50- and 100-hour Exponential Moving Averages (EMAs). It’s worth noting that the 50-hour EMA is on the verge of crossing below the 100-hour EMA. If a decisive crossover occurs on the four-hour chart, it would validate a Bear Cross, highlighting the path of least resistance for the cross is to the downside.
The first resistance level of GBP/JPY is seen at 184.40 (a confluence of the 50- and 100-hour EMA). The additional upside filter to watch is 185.35 (the upper boundary of the descending triangle pattern). Any meaningful follow-through buying will see the next stop at 186.00 (a psychological round mark, a high of August 23).
On the flip side, a decisive break below the lower limit of the descending triangle pattern of 183.10 will see a drop to 182.55 (a high of July 21) en route to 182.35 (a low of August 9) and a psychological round mark at 182.00.
Furthermore, the Relative Strength Index (RSI) is located in bearish territory below 50, highlighting that further downside cannot be ruled out.
Technical Levels: Supports and Resistances
GBPJPY currently trading at 183.38 at the time of writing. Pair opened at 184.28 and is trading with a change of -0.49 % .
| Overview | Overview.1 | |
|---|---|---|
| 0 | Today last price | 183.38 |
| 1 | Today Daily Change | -0.90 |
| 2 | Today Daily Change % | -0.49 |
| 3 | Today daily open | 184.28 |
The pair is trading below its 20 Daily moving average @ 184.92, above its 50 Daily moving average @ 183.14 , above its 100 Daily moving average @ 178.67 and above its 200 Daily moving average @ 170.45
| Trends | Trends.1 | |
|---|---|---|
| 0 | Daily SMA20 | 184.92 |
| 1 | Daily SMA50 | 183.14 |
| 2 | Daily SMA100 | 178.67 |
| 3 | Daily SMA200 | 170.45 |
The previous day high was 184.47 while the previous day low was 183.07. The daily 38.2% Fib levels comes at 183.93, expected to provide resistance. Similarly, the daily 61.8% fib level is at 183.6, expected to provide resistance.
Note the levels of interest below:
- Pivot support is noted at 183.41, 182.54, 182.01
- Pivot resistance is noted at 184.81, 185.34, 186.21
| Levels | Levels.1 |
|---|---|
| Previous Daily High | 184.47 |
| Previous Daily Low | 183.07 |
| Previous Weekly High | 185.78 |
| Previous Weekly Low | 183.07 |
| Previous Monthly High | 186.77 |
| Previous Monthly Low | 180.46 |
| Daily Fibonacci 38.2% | 183.93 |
| Daily Fibonacci 61.8% | 183.60 |
| Daily Pivot Point S1 | 183.41 |
| Daily Pivot Point S2 | 182.54 |
| Daily Pivot Point S3 | 182.01 |
| Daily Pivot Point R1 | 184.81 |
| Daily Pivot Point R2 | 185.34 |
| Daily Pivot Point R3 | 186.21 |
[/s2If]
Download Nehcap EAWe have two EAs that are operational on our LIVE accounts.
- EA-FIX: Check out the details here. Download EA-FIX . EA-FIX is a non-grid HFT scalper.
- EA-GROWTH: High quality low dd EA using trend grids. Download EA_GROWTHJoin Our Telegram Group
")


