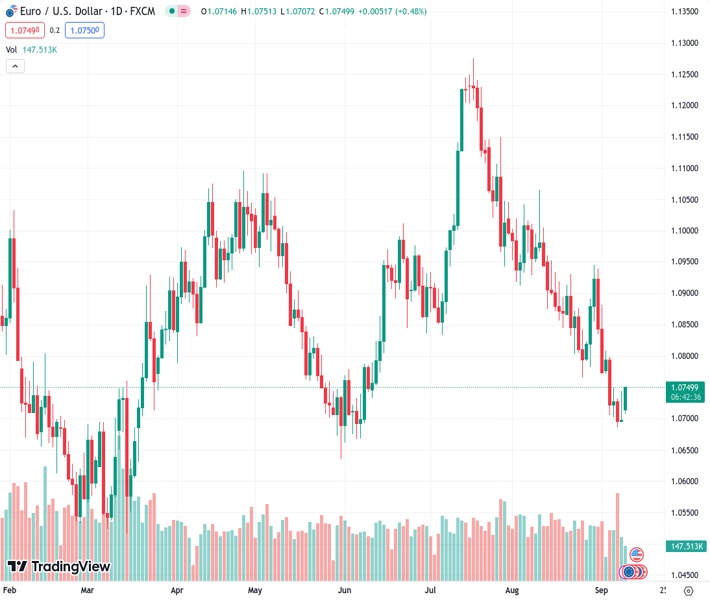
In a positive market sentiment, the EURUSD currency pair is protecting its near-term support level of 1.0700, as it currently stands at 1.07482.
…
This is a premium post.
[s2If !current_user_can(access_s2member_level4)]Please register for FREE REGISTER to read full post below containing analysis. In case of any error or you think you are not able to read the full post below, please email us at support#nehcap.com [lwa][/s2If] [s2If current_user_can(access_s2member_level1)]
- EUR/USD defends the immediate support of 1.0700 amid a risk-on mood.
The pair currently trades last at 1.07482.
The previous day high was 1.0744 while the previous day low was 1.0694. The daily 38.2% Fib levels comes at 1.0725, expected to provide support. Similarly, the daily 61.8% fib level is at 1.0713, expected to provide support.
The EUR/USD pair managed to defend the round-level support of 1.0700 on Monday. The major currency pair broadly struggles for a decisive move as investors await the United States Consumer Price Index (CPI) data for August, which will be published on Wednesday at 12:30 GMT.
S&P500 opens on a bullish note amid a cheerful market mood as investors shift focus to the context that the Federal Reserve (Fed) would not raise interest rates in the remaining year. The US Dollar Index remains under pressure after a nominal improvement in China’s inflation.
On the Eurozone front, investors remain uncertain about the interest rate decision by the European Central Bank (ECB) for September monetary policy. Analysts at Commerzbank a majority of the ECB council members will probably vote for unchanged key rates due to the weak economy and the downward trend in the inflation rate.
EUR/USD trades in a Symmetrical Triangle chart pattern on an hourly scale, which indicates a volatility squeeze. The downward-sloping trendline is plotted from September 6 high at 1.0749 while the upward-sloping trendline is placed from September 7 low at 1.0686.
The shared currency pair remains closer to the 20-period Exponential Moving Average (EMA) at 1.0725 for the past three trading sessions, portraying a sideways performance.
Meanwhile, the Relative Strength Index (RSI) (14) oscillates in the 40.00-60.00, demonstrating a directionless performance ahead of the US inflation data.
Fresh upside bias would appear if the asset delivers a breakout of the neutral triangle September 8 high at 1.0744. A decisive break would send the major toward the horizontal resistances plotted from September 4 high at 1.0809 and September 1 high at 1.0882.
In an alternate scenario, a breakdown below September 7 low at 1.0686 would expose the asset to May low at 1.0635. A slippage below the latter would expose the asset to the round-level support of 1.0600.
Technical Levels: Supports and Resistances
EURUSD currently trading at 1.0736 at the time of writing. Pair opened at 1.0701 and is trading with a change of 0.33 % .
| Overview | Overview.1 | |
|---|---|---|
| 0 | Today last price | 1.0736 |
| 1 | Today Daily Change | 0.0035 |
| 2 | Today Daily Change % | 0.3300 |
| 3 | Today daily open | 1.0701 |
The pair remains strongly bearish on the daily time frame. It trades below the 20 SMA @ 1.0827, 50 SMA 1.095, 100 SMA @ 1.091 and 200 SMA @ 1.0823.
| Trends | Trends.1 | |
|---|---|---|
| 0 | Daily SMA20 | 1.0827 |
| 1 | Daily SMA50 | 1.0950 |
| 2 | Daily SMA100 | 1.0910 |
| 3 | Daily SMA200 | 1.0823 |
The previous day high was 1.0744 while the previous day low was 1.0694. The daily 38.2% Fib levels comes at 1.0725, expected to provide support. Similarly, the daily 61.8% fib level is at 1.0713, expected to provide support.
Note the levels of interest below:
- Pivot support is noted at 1.0682, 1.0663, 1.0632
- Pivot resistance is noted at 1.0732, 1.0763, 1.0781
| Levels | Levels.1 |
|---|---|
| Previous Daily High | 1.0744 |
| Previous Daily Low | 1.0694 |
| Previous Weekly High | 1.0809 |
| Previous Weekly Low | 1.0686 |
| Previous Monthly High | 1.1065 |
| Previous Monthly Low | 1.0766 |
| Daily Fibonacci 38.2% | 1.0725 |
| Daily Fibonacci 61.8% | 1.0713 |
| Daily Pivot Point S1 | 1.0682 |
| Daily Pivot Point S2 | 1.0663 |
| Daily Pivot Point S3 | 1.0632 |
| Daily Pivot Point R1 | 1.0732 |
| Daily Pivot Point R2 | 1.0763 |
| Daily Pivot Point R3 | 1.0781 |
[/s2If]
Download Nehcap EAWe have two EAs that are operational on our LIVE accounts.
- EA-FIX: Check out the details here. Download EA-FIX . EA-FIX is a non-grid HFT scalper.
- EA-GROWTH: High quality low dd EA using trend grids. Download EA_GROWTHJoin Our Telegram Group
")


