The USD to CHF exchange rate increased slightly from 0.89346 to 0.8930, resulting in modest gains.
…
This is a premium post.
[s2If !current_user_can(access_s2member_level4)]Please register for FREE REGISTER to read full post below containing analysis. In case of any error or you think you are not able to read the full post below, please email us at support#nehcap.com [lwa][/s2If] [s2If current_user_can(access_s2member_level1)]
- USD/CHF advanced towards 0.8930, seeing mild gains.
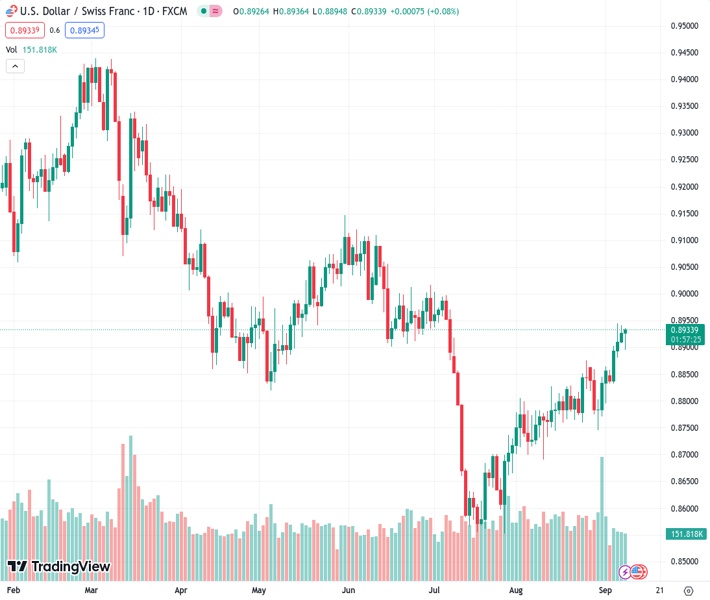
The pair currently trades last at 0.89346.
The previous day high was 0.894 while the previous day low was 0.8908. The daily 38.2% Fib levels comes at 0.8928, expected to provide support. Similarly, the daily 61.8% fib level is at 0.8921, expected to provide support.
Despite FX markets being driven by a positive market mood and a declining US Dollar (USD), the USD/CHF continued to gain ground, but bulls are losing momentum. Still, the pair will close a 0.86% weekly gain, its highest since May.
For the rest of the session, the economic calendar will remain quiet, and investors await fresh catalysts to place their bets for the next Federal Reserve (Fed) decisions. Next week, the US will report Consumer Price Index (CPI) figures from August, which is expected to have accelerated. Retail Sales from the same month, expected to have decelerated, will also be watched.
Regarding the Federal Reserve (Fed) expectations, the CME FedWatch tool indicates that markets have already priced in a pause in the September 20 meeting, and the probabilities for the November and December meetings show that the odds of a 25 basis point (bps) hike wander around 40%. In that sense, as long as tightening expectations for the Fed remain high, the USD’s losses are limited.
The daily chart highlights a neutral to bullish technical outlook for USD/CHF as signs of buying exhaustion become evident. With a flat slope above its midline, the Relative Strength Index (RSI) suggests that the pair may consolidate gains in the next sessions, while the Moving Average Convergence (MACD) histogram exhibits stagnant green bars.
Support levels: 0.8900, 0.8877 (100-day SMA), 0.8850.
Resistance levels: 0.8950, 0.9000, 0.9030.
Technical Levels: Supports and Resistances
USDCHF currently trading at 0.8932 at the time of writing. Pair opened at 0.8928 and is trading with a change of 0.04 % .
| Overview | Overview.1 | |
|---|---|---|
| 0 | Today last price | 0.8932 |
| 1 | Today Daily Change | 0.0004 |
| 2 | Today Daily Change % | 0.0400 |
| 3 | Today daily open | 0.8928 |
The pair is trading above its 20 Daily moving average @ 0.8824, above its 50 Daily moving average @ 0.8778 , above its 100 Daily moving average @ 0.8879 and below its 200 Daily moving average @ 0.9056
| Trends | Trends.1 | |
|---|---|---|
| 0 | Daily SMA20 | 0.8824 |
| 1 | Daily SMA50 | 0.8778 |
| 2 | Daily SMA100 | 0.8879 |
| 3 | Daily SMA200 | 0.9056 |
The previous day high was 0.894 while the previous day low was 0.8908. The daily 38.2% Fib levels comes at 0.8928, expected to provide support. Similarly, the daily 61.8% fib level is at 0.8921, expected to provide support.
Note the levels of interest below:
- Pivot support is noted at 0.8911, 0.8894, 0.8879
- Pivot resistance is noted at 0.8942, 0.8957, 0.8974
| Levels | Levels.1 |
|---|---|
| Previous Daily High | 0.8940 |
| Previous Daily Low | 0.8908 |
| Previous Weekly High | 0.8865 |
| Previous Weekly Low | 0.8745 |
| Previous Monthly High | 0.8876 |
| Previous Monthly Low | 0.8690 |
| Daily Fibonacci 38.2% | 0.8928 |
| Daily Fibonacci 61.8% | 0.8921 |
| Daily Pivot Point S1 | 0.8911 |
| Daily Pivot Point S2 | 0.8894 |
| Daily Pivot Point S3 | 0.8879 |
| Daily Pivot Point R1 | 0.8942 |
| Daily Pivot Point R2 | 0.8957 |
| Daily Pivot Point R3 | 0.8974 |
[/s2If]
Download Nehcap EAWe have two EAs that are operational on our LIVE accounts.
- EA-FIX: Check out the details here. Download EA-FIX . EA-FIX is a non-grid HFT scalper.
- EA-GROWTH: High quality low dd EA using trend grids. Download EA_GROWTHJoin Our Telegram Group
")


