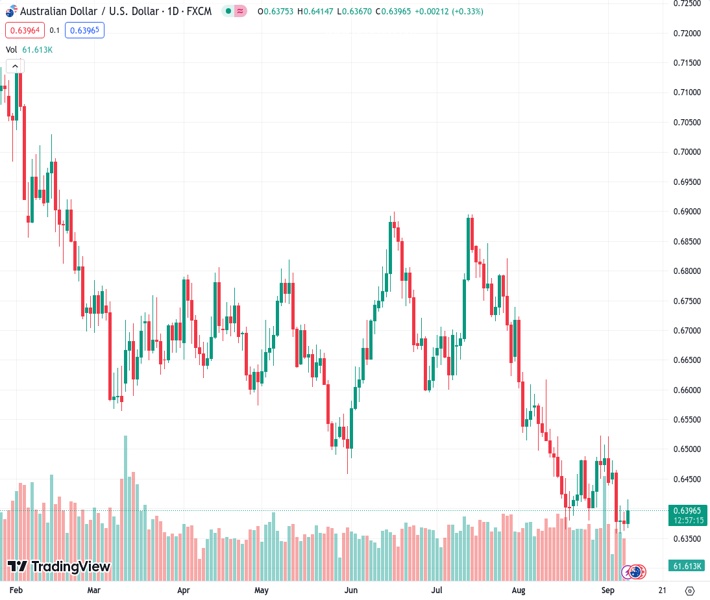
The exchange rate of the Australian Dollar to the US Dollar is currently at 0.6390, an increase from the previous rate of 0.63783. However, it is still facing downward pressure due to concerns related to China.
…
This is a premium post.
[s2If !current_user_can(access_s2member_level4)]Please register for FREE REGISTER to read full post below containing analysis. In case of any error or you think you are not able to read the full post below, please email us at support#nehcap.com [lwa][/s2If] [s2If current_user_can(access_s2member_level1)]
- AUD/USD trades higher around 0.6390 but remains under pressure due to China-linked fears.
The pair currently trades last at 0.63783.
The previous day high was 0.6395 while the previous day low was 0.6362. The daily 38.2% Fib levels comes at 0.6375, expected to provide support. Similarly, the daily 61.8% fib level is at 0.6383, expected to provide resistance.
AUD/USD recovers from the previous day’s losses, trading higher around 0.6390 during the early hours of the European session on Friday. The Australian Dollar (AUD) experienced downward pressure due to the Chinese economic fears along with US-China trade tensions. Additionally, investors are expecting a dovish stance by the Reserve Bank of Australia (RBA) regarding the interest rate-hike cycle.
Moreover, Chinese President Xi Jinping’s decision not to attend the G20 leaders’ summit in New Delhi this upcoming Saturday is anticipated to further intensify the existing strain in the already fragile and deteriorating relationship between China and the United States (US), particularly with the presence of US President Joe Biden at the event.
The Moving Average Convergence Divergence (MACD) line stays below the centerline but lies above the signal line. This configuration indicates that the recent momentum is relatively tepid and in a sideways direction.
The pair could find immediate support around the weekly low at 0.6357 level lined up with the 0.6350 psychological level. A firm break below that level could push the AUD/USD pair to navigate the region around the 0.6200 level.
On the upside, the 0.6400 psychological level is acting as a key resistance, following the 21-day Exponential Moving Average (EMA) at 0.6454 aligned to the 23.6% Fibonacci retracement at 0.6483 level.
In the near future, it is anticipated that the AUD/USD pair will continue to exhibit a bearish outlook, provided that the 14-day Relative Strength Index (RSI) remains below the 50 level.
Technical Levels: Supports and Resistances
AUDUSD currently trading at 0.6394 at the time of writing. Pair opened at 0.6376 and is trading with a change of 0.28 % .
| Overview | Overview.1 | |
|---|---|---|
| 0 | Today last price | 0.6394 |
| 1 | Today Daily Change | 0.0018 |
| 2 | Today Daily Change % | 0.2800 |
| 3 | Today daily open | 0.6376 |
The pair remains strongly bearish on the daily time frame. It trades below the 20 SMA @ 0.6437, 50 SMA 0.6586, 100 SMA @ 0.663 and 200 SMA @ 0.6715.
| Trends | Trends.1 | |
|---|---|---|
| 0 | Daily SMA20 | 0.6437 |
| 1 | Daily SMA50 | 0.6586 |
| 2 | Daily SMA100 | 0.6630 |
| 3 | Daily SMA200 | 0.6715 |
The previous day high was 0.6395 while the previous day low was 0.6362. The daily 38.2% Fib levels comes at 0.6375, expected to provide support. Similarly, the daily 61.8% fib level is at 0.6383, expected to provide resistance.
Note the levels of interest below:
- Pivot support is noted at 0.636, 0.6345, 0.6327
- Pivot resistance is noted at 0.6393, 0.641, 0.6426
| Levels | Levels.1 |
|---|---|
| Previous Daily High | 0.6395 |
| Previous Daily Low | 0.6362 |
| Previous Weekly High | 0.6522 |
| Previous Weekly Low | 0.6401 |
| Previous Monthly High | 0.6724 |
| Previous Monthly Low | 0.6364 |
| Daily Fibonacci 38.2% | 0.6375 |
| Daily Fibonacci 61.8% | 0.6383 |
| Daily Pivot Point S1 | 0.6360 |
| Daily Pivot Point S2 | 0.6345 |
| Daily Pivot Point S3 | 0.6327 |
| Daily Pivot Point R1 | 0.6393 |
| Daily Pivot Point R2 | 0.6410 |
| Daily Pivot Point R3 | 0.6426 |
[/s2If]
Download Nehcap EAWe have two EAs that are operational on our LIVE accounts.
- EA-FIX: Check out the details here. Download EA-FIX . EA-FIX is a non-grid HFT scalper.
- EA-GROWTH: High quality low dd EA using trend grids. Download EA_GROWTHJoin Our Telegram Group
")


