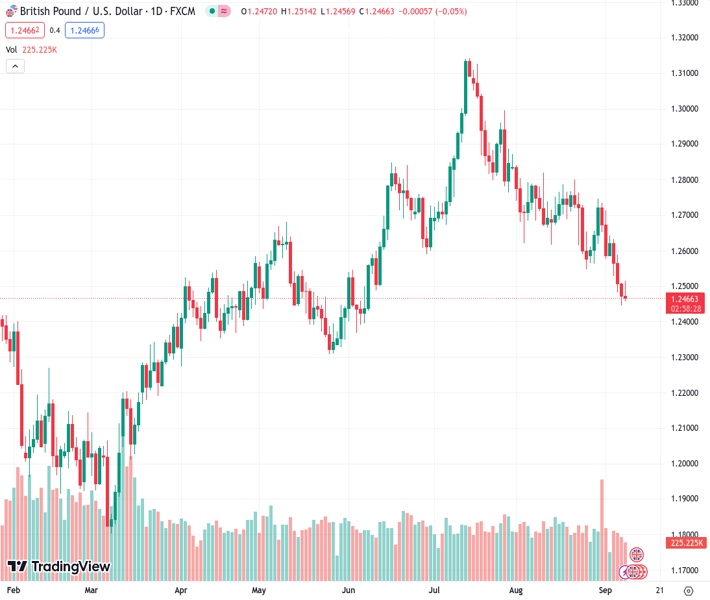
The currency pair GBPUSD, currently trading at 1.24649, experiences a decrease to 1.2458, which brings attention to the 200-day Moving Average at 1.2424.
…
This is a premium post.
[s2If !current_user_can(access_s2member_level4)]Please register for FREE REGISTER to read full post below containing analysis. In case of any error or you think you are not able to read the full post below, please email us at support#nehcap.com [lwa][/s2If] [s2If current_user_can(access_s2member_level1)]
- GBP/USD drops to 1.2458 and puts the 200-day Moving Average at 1.2424 in focus.
The pair currently trades last at 1.24649.
The previous day high was 1.2509 while the previous day low was 1.2446. The daily 38.2% Fib levels comes at 1.247, expected to provide resistance. Similarly, the daily 61.8% fib level is at 1.2485, expected to provide resistance.
The Pound Sterling (GBP) extended its free fall for four straight days versus the US Dollar (USD) due to high US bond yields underpinning the Greenback. The GBP/USD is trading at 1.2458 after hitting a daily high of 1.2514, as sellers set their sights on technical support to prolong their profits.
After breaking an upslope support trendline drawn from around May lows, the major dropped below the psychological 1.2500 figure, which exposed the 200-day Moving Average (DMA) at 1.2424. A breach of the latter would shift the pair’s bias to neutral downwards and expose the May 25 swing low at 1.2308, a crucial support area. That could break the uptrend market structure and pave the way for further losses.
Short-term, the GPB/USD hourly chart shows an attempt by buyers to reclaim the 1.2500 figure. AS buyers failed, the pair dived towards the session’s lows, below Friday’s central pivot point, eyeing the week’s low at 1.2455. A breach of the latter could expose the S2 daily pivot at 1.2413, followed by the 1.2400 mark. Conversely, if traders reclaim 1.2500, that could open the door for further upside, with traders eyeing the 200-hour Moving Average (HMA) at 1.2593 before challenging 1.2600.
Technical Levels: Supports and Resistances
GBPUSD currently trading at 1.2463 at the time of writing. Pair opened at 1.2472 and is trading with a change of -0.07 % .
| Overview | Overview.1 | |
|---|---|---|
| 0 | Today last price | 1.2463 |
| 1 | Today Daily Change | -0.0009 |
| 2 | Today Daily Change % | -0.0700 |
| 3 | Today daily open | 1.2472 |
The pair is trading below its 20 Daily moving average @ 1.2655, below its 50 Daily moving average @ 1.2766 , below its 100 Daily moving average @ 1.2655 and above its 200 Daily moving average @ 1.2426
| Trends | Trends.1 | |
|---|---|---|
| 0 | Daily SMA20 | 1.2655 |
| 1 | Daily SMA50 | 1.2766 |
| 2 | Daily SMA100 | 1.2655 |
| 3 | Daily SMA200 | 1.2426 |
The previous day high was 1.2509 while the previous day low was 1.2446. The daily 38.2% Fib levels comes at 1.247, expected to provide resistance. Similarly, the daily 61.8% fib level is at 1.2485, expected to provide resistance.
Note the levels of interest below:
- Pivot support is noted at 1.2442, 1.2413, 1.2379
- Pivot resistance is noted at 1.2505, 1.2539, 1.2568
| Levels | Levels.1 |
|---|---|
| Previous Daily High | 1.2509 |
| Previous Daily Low | 1.2446 |
| Previous Weekly High | 1.2746 |
| Previous Weekly Low | 1.2563 |
| Previous Monthly High | 1.2841 |
| Previous Monthly Low | 1.2548 |
| Daily Fibonacci 38.2% | 1.2470 |
| Daily Fibonacci 61.8% | 1.2485 |
| Daily Pivot Point S1 | 1.2442 |
| Daily Pivot Point S2 | 1.2413 |
| Daily Pivot Point S3 | 1.2379 |
| Daily Pivot Point R1 | 1.2505 |
| Daily Pivot Point R2 | 1.2539 |
| Daily Pivot Point R3 | 1.2568 |
[/s2If]
Download Nehcap EAWe have two EAs that are operational on our LIVE accounts.
- EA-FIX: Check out the details here. Download EA-FIX . EA-FIX is a non-grid HFT scalper.
- EA-GROWTH: High quality low dd EA using trend grids. Download EA_GROWTHJoin Our Telegram Group
")


