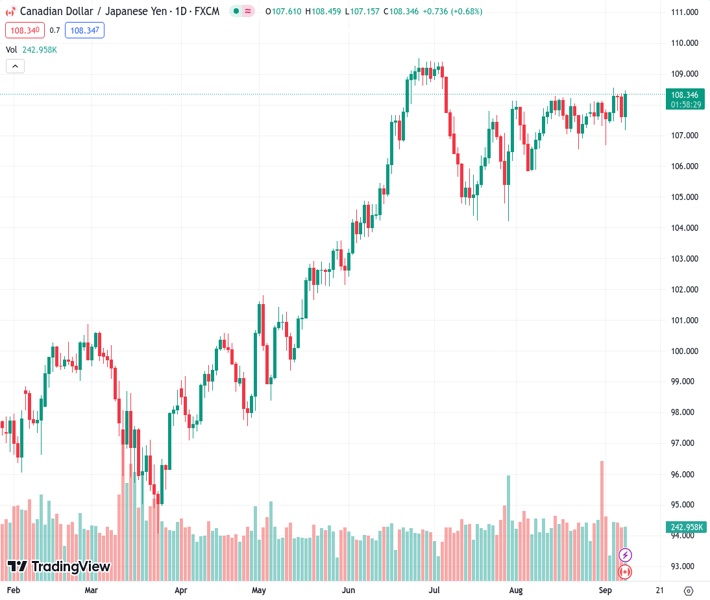
The CADJPY pair, currently trading at 108.3500, has increased by 0.72% to reach 108.38. This rise in value is a result of the Canadian jobs report surpassing predictions, with the addition of 15K jobs and a decrease in the unemployment rate to 5.5%.
…
This is a premium post.
[s2If !current_user_can(access_s2member_level4)]Please register for FREE REGISTER to read full post below containing analysis. In case of any error or you think you are not able to read the full post below, please email us at support#nehcap.com [lwa][/s2If] [s2If current_user_can(access_s2member_level1)]
- CAD/JPY rises 0.72% to 108.38 after Canadian jobs report beats expectations, adding 15K jobs and pushing the unemployment rate to 5.5%.
The pair currently trades last at 108.3500.
The previous day high was 108.38 while the previous day low was 107.41. The daily 38.2% Fib levels comes at 107.78, expected to provide support. Similarly, the daily 61.8% fib level is at 108.01, expected to provide support.
The Loonie (CAD) posts solid gains versus the Japanese Yen (JPY) on Friday after an upbeat Canadian jobs report sparked speculations the Bank of Canada would increase rates at a subsequent meeting. That and investors’ risk appetite weighed on the Yen’s safe-haven status. At the time of writing, the CAD/JPY exchanges hands at 108.38, up 0.72% or +77 pips.
Statistics Canada revealed that the Canadian economy created more jobs than foreseen at 15K in August, with 39.9K people adding to the workforce, while the unemployment rate stood at 5.5%. The labor market has remained resilient, even though the Bank of Canada (BoC) has lifted rates ten times since March 2022.
Digging deeper into the data, a measure of wages rose by 5.2% in August from 5% in July, increasing the chances the BoC would step in and lift rates. Of note, the BoC kept rates unchanged on September 6 at 5%, but after the data release, the money market futures show odds at 44% chance of another BoC rate hike by the year’s end, from 36% before the employment report crossed the screens.
The data comes one day after the BoC Governor Tiff Macklem said that interest rates may not be high enough to bring supply and demand in balance, bringing inflation down. The BoC’s decision to hold rates unchanged was attributed to Q2’s 2023 unexpectedly contracted -0.2%, signaling the economy could’ve entered a recession.
Aside from this, data from Japan witnessed the economy growing slower than expected, with Q2’s GDP at 4.8% YoY, below the 5.5% estimated. Although it was negative, a risk-off impulse benefitted the Yen during the Asian and European sessions. Nevertheless, as Japanese authorities remained mute about a possible Forex intervention, it was outpaced by Canadian data.
Therefore, further CAD/JPY upside is expected, though caution is warranted on intervention threats and overextended price action.
From a technical perspective, the CAD/JPY is neutral to upward bias, remaining above the Ichimoku cloud (Kumo) but failing to reach the year-to-date (YTD) high at 109.50. A decisive break would expose the 110.00 psychological level before testing last year’s high of 110.52. Failure at 109.50 and sellers would outweigh buyers and drag prices toward the Tenkan-Sen line at 107.61 before extending its losses to the Senkou-Span A at 107.39. Break below, and the pair would dive towards the Kijun-Sen at 107.18.
Technical Levels: Supports and Resistances
CADJPY currently trading at 108.32 at the time of writing. Pair opened at 107.64 and is trading with a change of 0.63 % .
| Overview | Overview.1 | |
|---|---|---|
| 0 | Today last price | 108.32 |
| 1 | Today Daily Change | 0.68 |
| 2 | Today Daily Change % | 0.63 |
| 3 | Today daily open | 107.64 |
The pair remains strongly bullish on the daily timeframe. It trades above its 20 SMA @ 107.77, 50 SMA 107.22, 100 SMA @ 105.23 and 200 SMA @ 101.77.
| Trends | Trends.1 | |
|---|---|---|
| 0 | Daily SMA20 | 107.77 |
| 1 | Daily SMA50 | 107.22 |
| 2 | Daily SMA100 | 105.23 |
| 3 | Daily SMA200 | 101.77 |
The previous day high was 108.38 while the previous day low was 107.41. The daily 38.2% Fib levels comes at 107.78, expected to provide support. Similarly, the daily 61.8% fib level is at 108.01, expected to provide support.
Note the levels of interest below:
- Pivot support is noted at 107.24, 106.84, 106.27
- Pivot resistance is noted at 108.21, 108.78, 109.18
| Levels | Levels.1 |
|---|---|
| Previous Daily High | 108.38 |
| Previous Daily Low | 107.41 |
| Previous Weekly High | 108.12 |
| Previous Weekly Low | 106.68 |
| Previous Monthly High | 113.32 |
| Previous Monthly Low | 105.71 |
| Daily Fibonacci 38.2% | 107.78 |
| Daily Fibonacci 61.8% | 108.01 |
| Daily Pivot Point S1 | 107.24 |
| Daily Pivot Point S2 | 106.84 |
| Daily Pivot Point S3 | 106.27 |
| Daily Pivot Point R1 | 108.21 |
| Daily Pivot Point R2 | 108.78 |
| Daily Pivot Point R3 | 109.18 |
[/s2If]
Download Nehcap EAWe have two EAs that are operational on our LIVE accounts.
- EA-FIX: Check out the details here. Download EA-FIX . EA-FIX is a non-grid HFT scalper.
- EA-GROWTH: High quality low dd EA using trend grids. Download EA_GROWTHJoin Our Telegram Group
")


