The USDINR currency pair decreases from its highest point in three weeks, ending a two-day period of consecutive gains.
…
This is a premium post.
[s2If !current_user_can(access_s2member_level4)]Please register for FREE REGISTER to read full post below containing analysis. In case of any error or you think you are not able to read the full post below, please email us at support#nehcap.com [lwa][/s2If] [s2If current_user_can(access_s2member_level1)]
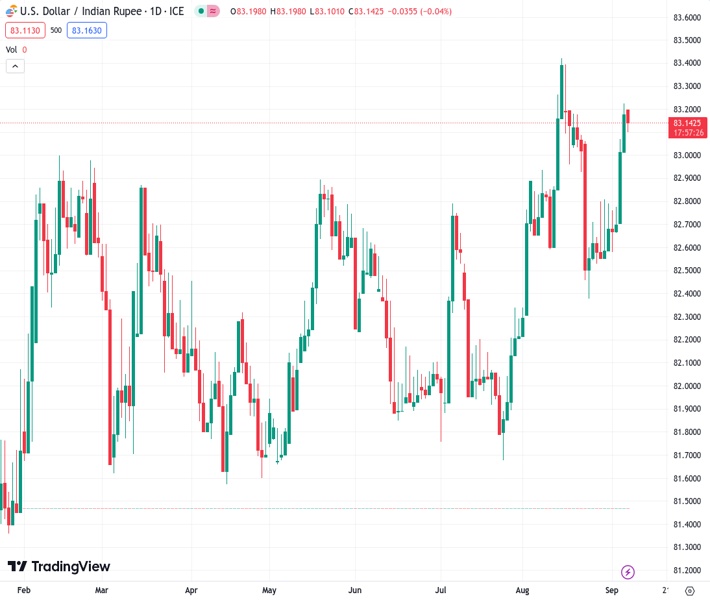
- USD/INR eases from a three-week high while snapping two-day winning streak.
The pair currently trades last at 83.1390.
The previous day high was 83.3714 while the previous day low was 82.9675. The daily 38.2% Fib levels comes at 83.2171, expected to provide resistance. Similarly, the daily 61.8% fib level is at 83.1218, expected to provide support.
USD/INR takes offers to extend the early-day reversal from a three-week high to 83.10 heading into Thursday’s European session. In doing so, the Indian Rupee (INR) pair prints the first daily loss in three amid a mixed cautious mood ahead of a slew of US data and Federal Reserve (Fed) policymakers’ speeches.
It’s worth noting, however, that the Indian Rupee (INR) pair remains on the way to posting the biggest weekly loss in five despite the latest retreat amid the firmer US Dollar and strong Oil Price. That said, the mixed China foreign trade numbers seemed to have allowed the USD/INR pair buyers to take a breather.
China’s headline Trade Balance eased to $68.3 billion in August from $80.6 billion, versus $73.9 billion prior whereas the Exports and Imports for the said month improved to -8.8% YoY and -7.3% YoY respectively versus -14.5% and -12.4% priors in that order.
On the other hand, the US Dollar Index (DXY) struggled at the highest level in six months, indecisive at 104.85 at the latest whereas WTI crude oil eased from a 10-month high, marked earlier in the week, to $86.75 by the press time.
Despite the recently mixed China data, pessimism surrounding the Asian leaders remains in the spotlight amid the early-week disappointment via China Caixin Services PMI, as well as the market’s lack of confidence in the Dragon Nation’s stimulus. The same contrasts with mostly upbeat US data and hawkish Fed talk to propel the US Dollar’s haven demand.
Additionally, favoring the Greenback and the USD/INR pair could be the US-China tension surrounding the trade conditions and Taiwan, as well as concerns favoring the soft landing in the US. The strong US activity and output data join the hawkish Federal Reserve (Fed) signals to highlight the US Dollar as the market’s favorite. On the same line could be the Fed’s Beige Book suggesting a soft landing in the US.
It should be observed that a surprise output cut extension by Russia and Saudi Arabia contrasts with a slightly lower inventory draw to prod the Oil buyers at the highest level since November 2022. That said, India relies heavily on energy imports and strong WTI crude oil prices keep weighing on the Rupee.
Looking forward, the USD/INR pair traders should watch Chinese catalysts for immediate directions ahead of the weekly US Initial Jobless Claims and the quarterly readings of Nonfarm Productivity, as well as the Unit Labor Costs for the second quarter (Q2) will decorate the calendar and should also be important to watch for clear directions. Furthermore, there are multiple Fed officials scheduled to deliver speeches and will provide fresh impulse.
USD/INR pullback remains elusive unless it stays beyond the 21-day SMA support of 82.95.
Technical Levels: Supports and Resistances
USDINR currently trading at 83.0764 at the time of writing. Pair opened at 83.3333 and is trading with a change of -0.31% % .
| Overview | Overview.1 | |
|---|---|---|
| 0 | Today last price | 83.0764 |
| 1 | Today Daily Change | -0.2569 |
| 2 | Today Daily Change % | -0.31% |
| 3 | Today daily open | 83.3333 |
The pair remains strongly bullish on the daily timeframe. It trades above its 20 SMA @ 82.94, 50 SMA 82.5657, 100 SMA @ 82.3842 and 200 SMA @ 82.3108.
| Trends | Trends.1 | |
|---|---|---|
| 0 | Daily SMA20 | 82.9400 |
| 1 | Daily SMA50 | 82.5657 |
| 2 | Daily SMA100 | 82.3842 |
| 3 | Daily SMA200 | 82.3108 |
The previous day high was 83.3714 while the previous day low was 82.9675. The daily 38.2% Fib levels comes at 83.2171, expected to provide resistance. Similarly, the daily 61.8% fib level is at 83.1218, expected to provide support.
Note the levels of interest below:
- Pivot support is noted at 83.0767, 82.8202, 82.6729
- Pivot resistance is noted at 83.4806, 83.6279, 83.8844
| Levels | Levels.1 |
|---|---|
| Previous Daily High | 83.3714 |
| Previous Daily Low | 82.9675 |
| Previous Weekly High | 82.8978 |
| Previous Weekly Low | 82.4635 |
| Previous Monthly High | 83.5505 |
| Previous Monthly Low | 82.2240 |
| Daily Fibonacci 38.2% | 83.2171 |
| Daily Fibonacci 61.8% | 83.1218 |
| Daily Pivot Point S1 | 83.0767 |
| Daily Pivot Point S2 | 82.8202 |
| Daily Pivot Point S3 | 82.6729 |
| Daily Pivot Point R1 | 83.4806 |
| Daily Pivot Point R2 | 83.6279 |
| Daily Pivot Point R3 | 83.8844 |
[/s2If]
Download Nehcap EAWe have two EAs that are operational on our LIVE accounts.
- EA-FIX: Check out the details here. Download EA-FIX . EA-FIX is a non-grid HFT scalper.
- EA-GROWTH: High quality low dd EA using trend grids. Download EA_GROWTHJoin Our Telegram Group
")


