The USD/CAD currency pair has experienced a positive shift and appears likely to continue its recent upward trend.
…
This is a premium post.
[s2If !current_user_can(access_s2member_level4)]Please register for FREE REGISTER to read full post below containing analysis. In case of any error or you think you are not able to read the full post below, please email us at support#nehcap.com [lwa][/s2If] [s2If current_user_can(access_s2member_level1)]
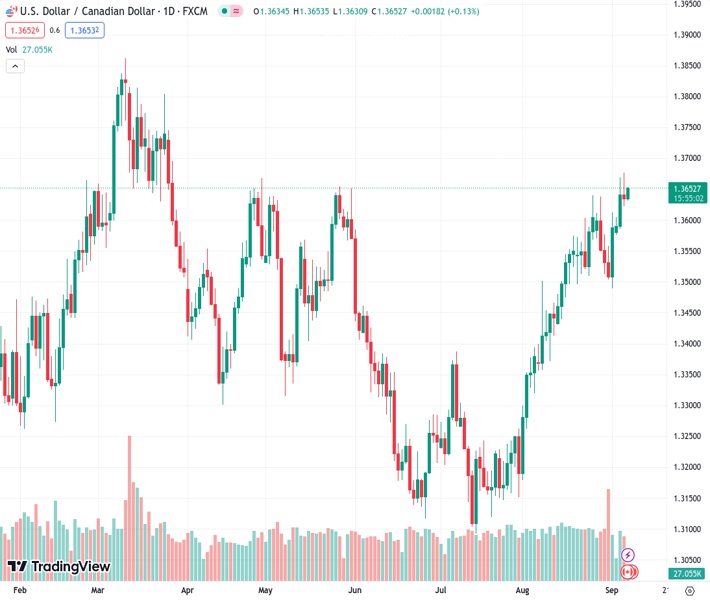
- USD/CAD regains positive traction and seems poised to prolong its near-term uptrend.
The pair currently trades last at 1.36510.
The previous day high was 1.3677 while the previous day low was 1.3623. The daily 38.2% Fib levels comes at 1.3643, expected to provide support. Similarly, the daily 61.8% fib level is at 1.3656, expected to provide resistance.
The USD/CAD pair attracts some dip-buying during the Asian session on Thursday and stalls the overnight modest pullback from the 1.3675 region, or its highest level since March 28. Spot prices currently trade just below mid-1.3600s, up less than 0.10% for the day, though seem poised to extend the recent well-established uptrend witnessed over the past month or so.
The underlying strong bullish sentiment surrounding the US Dollar (USD), bolstered by rising bets for one more rate hike by the Federal Reserve (Fed) in 2023, validates the positive outlook for the USD/CAD pair. In contrast, the Bank of Canada (BoC), though signalled on Wednesday that it could raise borrowing costs again to combat inflation, is expected to be relatively quick to cut rates in the wake of signs that the Canadian economy is cooling rapidly. This, along with retreating Crude Oil price, could undermine the commodity-linked Loonie and suggests that the path of least resistance for the major is to the upside.
From a technical perspective, this week’s sustained move beyond the 1.3600 mark was seen as a fresh trigger for bulls. That said, repeated failures to find acceptance above the 1.3645-1.3650 horizontal barrier warrant some caution before positioning for any further appreciating move for the USD/CAD pair. Moreover, the Relative Strength Index (RSI) on the daily chart has moved on the verge of breaking into the overbought territory and suggests that spot prices could consolidate in a range. Nevertheless, any corrective slide is likely to find support and attract fresh buyers near the 1.3600 resistance breakpoint.
Some follow-through selling, however, might expose the next relevant support near the 1.3525 region. This is closely followed by the 1.3500 psychological mark, below which the USD/CAD pair could accelerate the fall towards testing the very important 200-day Simple Moving Average (SMA), currently around the 1.3460 area. The latter should act as a pivotal point, A convincing break below will negate the positive outlook and shift the near-term bias in favour of bearish traders.
On the flip side, the 1.3670-1.3675 area, or the overnight swing high, could act as an immediate resistance, which if cleared should allow the USD/CAD pair to reclaim the 1.3700 mark. The momentum could get extended further towards the 1.3730 resistance zone en route to the 1.3800 round figure and the YTD peak, around the 1.3860 region touched in March.
Technical Levels: Supports and Resistances
USDCAD currently trading at 1.3647 at the time of writing. Pair opened at 1.3636 and is trading with a change of 0.08 % .
| Overview | Overview.1 | |
|---|---|---|
| 0 | Today last price | 1.3647 |
| 1 | Today Daily Change | 0.0011 |
| 2 | Today Daily Change % | 0.0800 |
| 3 | Today daily open | 1.3636 |
The pair remains strongly bullish on the daily timeframe. It trades above its 20 SMA @ 1.3547, 50 SMA 1.3371, 100 SMA @ 1.3402 and 200 SMA @ 1.3465.
| Trends | Trends.1 | |
|---|---|---|
| 0 | Daily SMA20 | 1.3547 |
| 1 | Daily SMA50 | 1.3371 |
| 2 | Daily SMA100 | 1.3402 |
| 3 | Daily SMA200 | 1.3465 |
The previous day high was 1.3677 while the previous day low was 1.3623. The daily 38.2% Fib levels comes at 1.3643, expected to provide support. Similarly, the daily 61.8% fib level is at 1.3656, expected to provide resistance.
Note the levels of interest below:
- Pivot support is noted at 1.3613, 1.3591, 1.3559
- Pivot resistance is noted at 1.3668, 1.37, 1.3722
| Levels | Levels.1 |
|---|---|
| Previous Daily High | 1.3677 |
| Previous Daily Low | 1.3623 |
| Previous Weekly High | 1.3637 |
| Previous Weekly Low | 1.3489 |
| Previous Monthly High | 1.3640 |
| Previous Monthly Low | 1.3184 |
| Daily Fibonacci 38.2% | 1.3643 |
| Daily Fibonacci 61.8% | 1.3656 |
| Daily Pivot Point S1 | 1.3613 |
| Daily Pivot Point S2 | 1.3591 |
| Daily Pivot Point S3 | 1.3559 |
| Daily Pivot Point R1 | 1.3668 |
| Daily Pivot Point R2 | 1.3700 |
| Daily Pivot Point R3 | 1.3722 |
[/s2If]
Download Nehcap EAWe have two EAs that are operational on our LIVE accounts.
- EA-FIX: Check out the details here. Download EA-FIX . EA-FIX is a non-grid HFT scalper.
- EA-GROWTH: High quality low dd EA using trend grids. Download EA_GROWTHJoin Our Telegram Group
")


