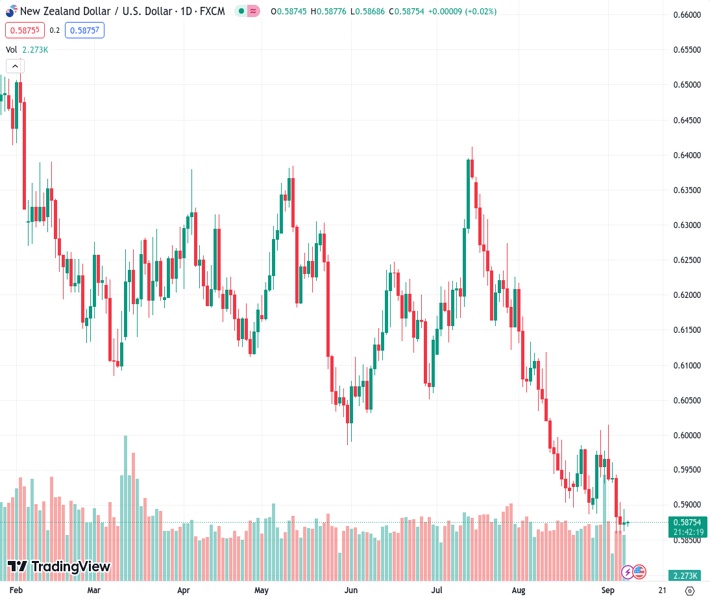
The NZDUSD pair is still cautious and defensive at around 0.5875 due to the hesitant market sentiment.
…
This is a premium post.
[s2If !current_user_can(access_s2member_level4)]Please register for FREE REGISTER to read full post below containing analysis. In case of any error or you think you are not able to read the full post below, please email us at support#nehcap.com [lwa][/s2If] [s2If current_user_can(access_s2member_level1)]
- NZD/USD remains on the defensive around 0.5875 amid the cautious mood.
The pair currently trades last at 0.58817.
The previous day high was 0.5899 while the previous day low was 0.5859. The daily 38.2% Fib levels comes at 0.5875, expected to provide support. Similarly, the daily 61.8% fib level is at 0.5884, expected to provide resistance.
The NZD/USD pair remains under pressure below the 0.5900 barrier during the early Asian session on Friday. The US Dollar (USD) gains momentum as investors price in a quarter basis point (bps) hike in interest rates by the Federal Reserve (Fed) for the rest of the year. The pair currently trades near 0.5875, gaining 0.03% on the day.
Data released by the US Department of Labor on Thursday showed that the US Initial Jobless Claims totaled 216,000 in the week ending of September 2. This figure surpassed the market’s forecast of 234,000 and followed the previous week’s revised figure of 229,000 (from 228,000). Meanwhile, Nonfarm Productivity rose by 3.5%, below the 3.8% market expectation and revised from the first estimate of 3.7%. In response to the data, the US Dollar Index (DXY) edged higher to the highest level since early March above the 105.00 area,
New York Federal Reserve (Fed) President John Williams stated that inflation is heading in the right direction while adding that he requires additional information before making a decision. Chicago’s Fed President Austan Goolsbee said the Fed may achieve the golden path, where inflation erases but a recession is avoided. Along with The Federal Reserve (Fed) Governor Christopher Waller last week, he said that there is further room to increase interest rates, but the data will determine whether the Fed needs to hike rates again and if it is done hiking rates.
Nevertheless, the US economic data lends support to the “higher for longer” interest rate narrative, which boosts the Greenback across the board. According to the CME FedWatch Tool, markets have priced in 93% odds of holding the interest rate at the September meeting, while the probability of raising rates in its November meeting is around 51%.
On the Kiwi front, Statistics New Zealand showed on Thursday that the nation’s Manufacturing Sales for the second quarter improved to 2.9% versus a 2.1% drop in the previous reading. Earlier this week, the ANZ Commodity Price for August dropped to 2.9% from a 2.6% decline in July. The New Zealand Terms of Trade Index improved to 0.4% in the second quarter, compared to a decline of 1.5% in the previous reading and an expected drop of 1.3%. Apart from the data, the fear of the economic slowdown in China and the property debt crisis might exert some selling pressure on the China-proxy New Zealand Dollar (NZD).
Moving on, market participants will digest the data and wait for fresh impetus. In the absence of top-tier economic figures from both New Zealand and the US, risk sentiment will be a key factor for the pair movement. On Saturday, the Chinese Consumer Price Index (CPI) YoY for August will be released and it might trigger volatility in the next sessions. These figures could give a clear direction for NZD/USD.
Technical Levels: Supports and Resistances
NZDUSD currently trading at 0.5876 at the time of writing. Pair opened at 0.5873 and is trading with a change of 0.05 % .
| Overview | Overview.1 | |
|---|---|---|
| 0 | Today last price | 0.5876 |
| 1 | Today Daily Change | 0.0003 |
| 2 | Today Daily Change % | 0.0500 |
| 3 | Today daily open | 0.5873 |
The pair remains strongly bearish on the daily time frame. It trades below the 20 SMA @ 0.5942, 50 SMA 0.6089, 100 SMA @ 0.6129 and 200 SMA @ 0.6216.
| Trends | Trends.1 | |
|---|---|---|
| 0 | Daily SMA20 | 0.5942 |
| 1 | Daily SMA50 | 0.6089 |
| 2 | Daily SMA100 | 0.6129 |
| 3 | Daily SMA200 | 0.6216 |
The previous day high was 0.5899 while the previous day low was 0.5859. The daily 38.2% Fib levels comes at 0.5875, expected to provide support. Similarly, the daily 61.8% fib level is at 0.5884, expected to provide resistance.
Note the levels of interest below:
- Pivot support is noted at 0.5855, 0.5838, 0.5816
- Pivot resistance is noted at 0.5895, 0.5917, 0.5934
| Levels | Levels.1 |
|---|---|
| Previous Daily High | 0.5899 |
| Previous Daily Low | 0.5859 |
| Previous Weekly High | 0.6015 |
| Previous Weekly Low | 0.5887 |
| Previous Monthly High | 0.6219 |
| Previous Monthly Low | 0.5885 |
| Daily Fibonacci 38.2% | 0.5875 |
| Daily Fibonacci 61.8% | 0.5884 |
| Daily Pivot Point S1 | 0.5855 |
| Daily Pivot Point S2 | 0.5838 |
| Daily Pivot Point S3 | 0.5816 |
| Daily Pivot Point R1 | 0.5895 |
| Daily Pivot Point R2 | 0.5917 |
| Daily Pivot Point R3 | 0.5934 |
[/s2If]
Download Nehcap EAWe have two EAs that are operational on our LIVE accounts.
- EA-FIX: Check out the details here. Download EA-FIX . EA-FIX is a non-grid HFT scalper.
- EA-GROWTH: High quality low dd EA using trend grids. Download EA_GROWTHJoin Our Telegram Group
")


