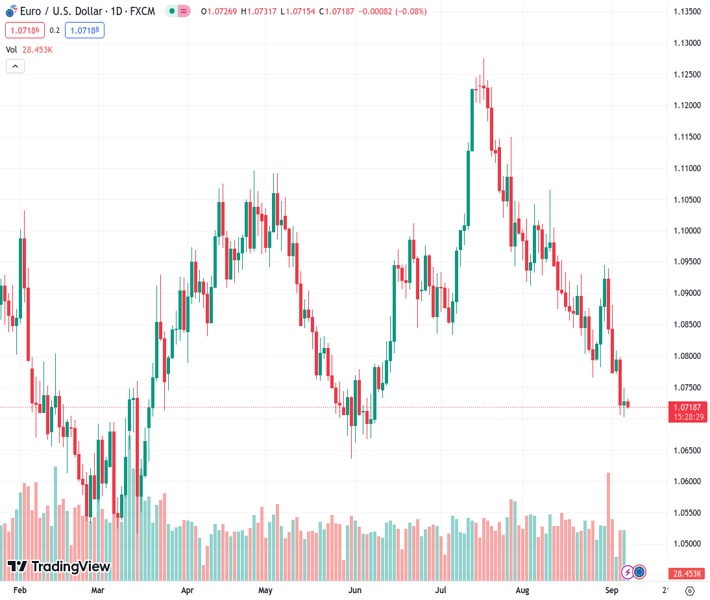
The EURUSD currency pair, trading at a rate of 1.07170, has lost momentum after a slight recovery from its lowest point in three months. It is now hitting a new bottom in today’s trading session.
…
This is a premium post.
[s2If !current_user_can(access_s2member_level4)]Please register for FREE REGISTER to read full post below containing analysis. In case of any error or you think you are not able to read the full post below, please email us at support#nehcap.com [lwa][/s2If] [s2If current_user_can(access_s2member_level1)]
- EUR/USD fades bounce off three-month low, renews intraday bottom of late.
The pair currently trades last at 1.07170.
The previous day high was 1.0749 while the previous day low was 1.0703. The daily 38.2% Fib levels comes at 1.0731, expected to provide resistance. Similarly, the daily 61.8% fib level is at 1.072, expected to provide resistance.
EUR/USD takes offers to refresh intraday low near 1.0718 but posts mild losses while reversing the previous day’s corrective bounce off a multi-day bottom heading into Thursday’s European session. I
The Euro pair retreats towards the lowest level in three months marked on Wednesday as the bloc’s currency remains pressured amid the European Central Bank’s (ECB) silence period ahead of next week’s monetary policy meeting. Apart from that, fears of Eurozone recession contrast with the US soft landing concerns, as well as the hawkish Federal Reserve (Fed) talks to also keep the major currency pair depressed as traders await German Industrial Production (IP) for July and the final readings of the Eurozone Gross Domestic Product (GDP) for the second quarter (Q2).
Mostly downbeat prints of the Eurozone statistics joined unimpressive comments from the ECB policymakers to propel the economic slowdown woes for the Old Continent, which in turn weighs on the Euro prices. Among the data, German Factory Orders and Eurozone Retail Sales recently disappointed the bloc’s currency while raising doubts about ECB President Christine Lagarde’s defense of hawkish bias. It’s worth noting that a slew of ECB Officials crossed wires on Wednesday to mark the last-ditched efforts to showcase their capacity to lift the rates but the markets couldn’t believe them more.
On the other hand, a surprise positive in ISM Services PMI and an absence of negative details of S&P Global PMIs for August joined hawkish Fed talks to defend the US Dollar amid hopes that the world’s largest economy can withstand higher rates. On the same line could be the Fed’s Beige Book suggesting a soft landing in the US.
Elsewhere, the US-China tension surrounding the trade conditions and Taiwan, as well as chatters that most other major economies outside the US will witness softer economic performance, also weighed on the sentiment and the EUR/USD pair, via the US Dollar’s haven demand.
Amid these plays, S&P 500 Futures remain pressured at the lowest level in a week, down for the fourth consecutive day while posting mild losses around 4,468 by the press time. That said, the US 10-year Treasury bond yields seesaw near the two-week high registered the previous day around 4.30%, near 4.29% at the latest, whereas the two-year counterpart prints the first daily loss in four by retreating from the weekly top to 5.01% as we write. With this, the US Dollar Index (DXY) remains firmer at the highest level in six months, mildly bid near 104.93 at the latest.
To sum up, the EUR/USD justifies the market’s preference for the US Dollar, especially when the ECB policymakers are barred from public speeches, which in turn highlights today’s US catalysts for clear directions.
A two-month-old previous support line joins a support-turned-resistance line stretched from March to restrict short-term EUR/USD upside near 1.0755 and 1.0785 respectively. It’s worth noting, however, that the 1.0700 round figure joins nearly oversold RSI (14) to test the Euro bears before directing them to May’s bottom of 1.0635.
Technical Levels: Supports and Resistances
EURUSD currently trading at 1.0719 at the time of writing. Pair opened at 1.0727 and is trading with a change of -0.07% % .
| Overview | Overview.1 | |
|---|---|---|
| 0 | Today last price | 1.0719 |
| 1 | Today Daily Change | -0.0008 |
| 2 | Today Daily Change % | -0.07% |
| 3 | Today daily open | 1.0727 |
The pair remains strongly bearish on the daily time frame. It trades below the 20 SMA @ 1.0853, 50 SMA 1.0957, 100 SMA @ 1.0916 and 200 SMA @ 1.0822.
| Trends | Trends.1 | |
|---|---|---|
| 0 | Daily SMA20 | 1.0853 |
| 1 | Daily SMA50 | 1.0957 |
| 2 | Daily SMA100 | 1.0916 |
| 3 | Daily SMA200 | 1.0822 |
The previous day high was 1.0749 while the previous day low was 1.0703. The daily 38.2% Fib levels comes at 1.0731, expected to provide resistance. Similarly, the daily 61.8% fib level is at 1.072, expected to provide resistance.
Note the levels of interest below:
- Pivot support is noted at 1.0704, 1.068, 1.0657
- Pivot resistance is noted at 1.075, 1.0772, 1.0796
| Levels | Levels.1 |
|---|---|
| Previous Daily High | 1.0749 |
| Previous Daily Low | 1.0703 |
| Previous Weekly High | 1.0946 |
| Previous Weekly Low | 1.0772 |
| Previous Monthly High | 1.1065 |
| Previous Monthly Low | 1.0766 |
| Daily Fibonacci 38.2% | 1.0731 |
| Daily Fibonacci 61.8% | 1.0720 |
| Daily Pivot Point S1 | 1.0704 |
| Daily Pivot Point S2 | 1.0680 |
| Daily Pivot Point S3 | 1.0657 |
| Daily Pivot Point R1 | 1.0750 |
| Daily Pivot Point R2 | 1.0772 |
| Daily Pivot Point R3 | 1.0796 |
[/s2If]
Download Nehcap EAWe have two EAs that are operational on our LIVE accounts.
- EA-FIX: Check out the details here. Download EA-FIX . EA-FIX is a non-grid HFT scalper.
- EA-GROWTH: High quality low dd EA using trend grids. Download EA_GROWTHJoin Our Telegram Group
")


