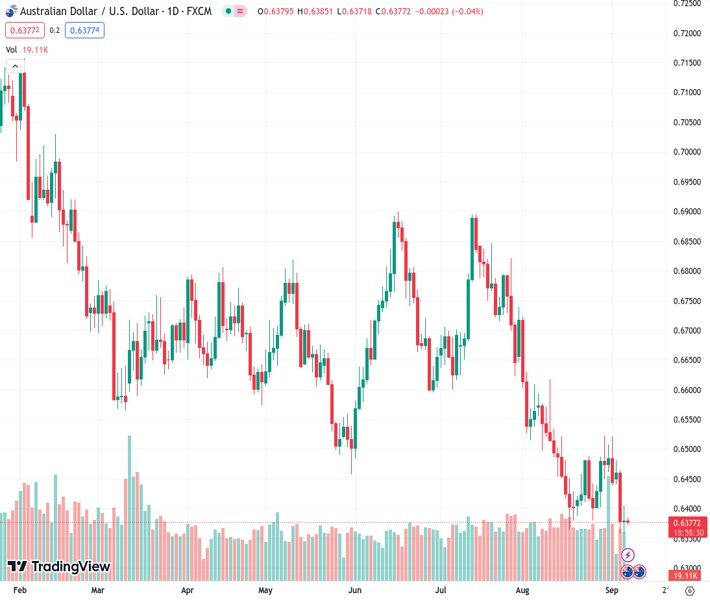
The AUDUSD currency pair is currently facing difficulties near the 0.6380 level following the release of disappointing trade data from Australia.
…
This is a premium post.
[s2If !current_user_can(access_s2member_level4)]Please register for FREE REGISTER to read full post below containing analysis. In case of any error or you think you are not able to read the full post below, please email us at support#nehcap.com [lwa][/s2If] [s2If current_user_can(access_s2member_level1)]
- AUD/USD struggles around 0.6380 after Australia’s downbeat trade data.
The pair currently trades last at 0.63763.
The previous day high was 0.6405 while the previous day low was 0.6357. The daily 38.2% Fib levels comes at 0.6387, expected to provide resistance. Similarly, the daily 61.8% fib level is at 0.6375, expected to provide support.
AUD/USD hovers near 0.6380 during the Asian session on Thursday, trading near the Year-To-Date (YTD). The firmer US Dollar (USD) is contributing support to undermine the AUD/USD pair as market participants anticipate the Federal Reserve (Fed) to maintain interest rates at a higher level for an extended period. Additionally, Australia’s downbeat Trade Balance (MoM) for July is reduced to 8,039M against the 10,000M expected. The balance was reported at 11,321M in the previous month.
The Australian Dollar (AUD) experienced minor support due to Australia’s upbeat Gross Domestic Product (GDP) for the second quarter released on Wednesday. GDP (YoY) grew at 2.1%, better than expectations of 1.7%. The growth rate was 2.4% in the previous quarter. GDP (QoQ) growth remained consistent at 0.4%, against the market consensus of 0.3%.
However, the Australian Treasurer, Jim Chalmers stated, “The slowdown in China’s economy and higher interest rates at home will put significant pressure on the Australian economy.” Chalmers also expressed confidence that Australia could steer clear of a recession.
The trade tensions between the US and China escalated, which could act as headwinds for the AUD/USD pair. The US Commerce Secretary Gina Raimondo’s statement as per Reuters. Raimondo expects no revisions to the US tariffs on China, which were imposed during Trump’s administration until the ongoing review by the US Treasury Office is completed.
Conversely, US ISM Services PMI improved to a six-month high reading of 54.5 in August against the expectations of 52.5 and 52.7 prior. Further, the S&P Global Composite and Services PMIs eased to 50.2 and 50.5 versus the market consensus of 50.4 and 51.0. It is worth noting that moderate US data provided support in underpinning the Greenback.
Additionally, the investors are pricing in the possibility of a 25 basis points (bps) interest rate hike through the end of the year 2023. This hawkish sentiment continues to support the US Treasury yields, bolstering the confidence of US Dollar (USD) bulls. The 10-year US bond yield rose to 4.29%, up by 0.23%. US Dollar Index (DXY) hovers around 104.90, which measures the value of the Greenback against the six other major currencies.
Investors await China’s trade data for August ahead of the Reserve Bank of Australia (RBA) Governor Philip Lowe’s speech for guidance on the market. However, the prevailing risk-averse sentiment and the strength of the US Dollar pose significant challenges for AUD/USD bulls.
Technical Levels: Supports and Resistances
AUDUSD currently trading at 0.6379 at the time of writing. Pair opened at 0.638 and is trading with a change of -0.02 % .
| Overview | Overview.1 | |
|---|---|---|
| 0 | Today last price | 0.6379 |
| 1 | Today Daily Change | -0.0001 |
| 2 | Today Daily Change % | -0.0200 |
| 3 | Today daily open | 0.6380 |
The pair remains strongly bearish on the daily time frame. It trades below the 20 SMA @ 0.6444, 50 SMA 0.6591, 100 SMA @ 0.6634 and 200 SMA @ 0.6717.
| Trends | Trends.1 | |
|---|---|---|
| 0 | Daily SMA20 | 0.6444 |
| 1 | Daily SMA50 | 0.6591 |
| 2 | Daily SMA100 | 0.6634 |
| 3 | Daily SMA200 | 0.6717 |
The previous day high was 0.6405 while the previous day low was 0.6357. The daily 38.2% Fib levels comes at 0.6387, expected to provide resistance. Similarly, the daily 61.8% fib level is at 0.6375, expected to provide support.
Note the levels of interest below:
- Pivot support is noted at 0.6356, 0.6333, 0.6309
- Pivot resistance is noted at 0.6404, 0.6428, 0.6451
| Levels | Levels.1 |
|---|---|
| Previous Daily High | 0.6405 |
| Previous Daily Low | 0.6357 |
| Previous Weekly High | 0.6522 |
| Previous Weekly Low | 0.6401 |
| Previous Monthly High | 0.6724 |
| Previous Monthly Low | 0.6364 |
| Daily Fibonacci 38.2% | 0.6387 |
| Daily Fibonacci 61.8% | 0.6375 |
| Daily Pivot Point S1 | 0.6356 |
| Daily Pivot Point S2 | 0.6333 |
| Daily Pivot Point S3 | 0.6309 |
| Daily Pivot Point R1 | 0.6404 |
| Daily Pivot Point R2 | 0.6428 |
| Daily Pivot Point R3 | 0.6451 |
[/s2If]
Download Nehcap EAWe have two EAs that are operational on our LIVE accounts.
- EA-FIX: Check out the details here. Download EA-FIX . EA-FIX is a non-grid HFT scalper.
- EA-GROWTH: High quality low dd EA using trend grids. Download EA_GROWTHJoin Our Telegram Group
")


