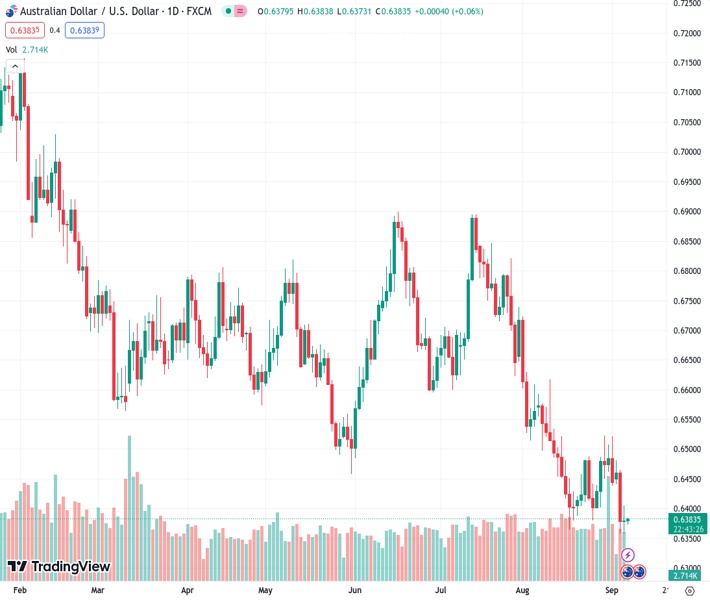
The AUDUSD currency pair is currently at a YTD low of 0.63837 and is stagnant, waiting for various important factors to influence its movement.
…
This is a premium post.
[s2If !current_user_can(access_s2member_level4)]Please register for FREE REGISTER to read full post below containing analysis. In case of any error or you think you are not able to read the full post below, please email us at support#nehcap.com [lwa][/s2If] [s2If current_user_can(access_s2member_level1)]
- AUD/USD remains sidelined at YTD low ahead of top multiple catalysts.
The pair currently trades last at 0.63837.
The previous day high was 0.6465 while the previous day low was 0.6358. The daily 38.2% Fib levels comes at 0.6399, expected to provide resistance. Similarly, the daily 61.8% fib level is at 0.6424, expected to provide resistance.
AUD/USD grinds near the Year-To-Date (YTD) low, after fading the corrective bounce off the lowest level in 10 months to 0.6380 a few hours back. That said, the Aussie pair refreshed the yearly bottom to 0.6357 amid broad US Dollar strength but the cautious mood ahead of the key catalysts and reconsideration of the previous day’s Australian growth numbers seemed to have challenged the pair sellers during the early hours of Thursday’s Asian session.
On Wednesday, Australia’s second quarter (Q2) Gross Domestic Product (GDP) rose to 0.4% QoQ versus 0.3% marked expectation and 0.2% prior readings but the yearly figures eased to 2.1% YoY from 2.3% previous readouts, versus the analysts’ estimations of 1.7%.
The Aussie growth numbers defy downbeat comments from Australian Treasurer Jim Chalmers who said before the release that “The slowdown in China’s economy and higher interest rates at home will put significant pressure on the Australian economy.” The policymaker, however, added that the country should manage to avoid a recession. With this, the Aussie pair managed to edge higher during the early hours of Wednesday.
However, China’s woes and the US data were comparatively more important and drowned the AUD/USD pair afterward.
China’s early-week disappointment via China Caixin Services PMI joined the market’s lack of confidence in the Dragon Nation’s stimulus to weigh on the concerns about Beijing. On the same line could be the US-China tension surrounding the trade conditions and Taiwan.
Late on Tuesday, US Commerce Secretary Gina Raimondo ruled out expectations of witnessing any revisions to US tariffs on China imposed during President Donald Trump’s administration until an ongoing review is completed by the US Trade Representative’s (USTR) Office, reported Reuters while citing the CNBC interview of the diplomat. These comments flag the continuation of the US-China tension and joined the fears about China’s economic recovery to weigh on the sentiment, which in turn underpinned the US Dollar’s run-up.
On the other hand, US ISM Services PMI rose to a six-month high of 54.5 in August versus 52.5 expected and 52.7 prior. Further, the final readings of the S&P Global Composite and Services PMIs eased to 50.2 and 50.5 for the said month compared to the initial estimations of 50.4 and 51.0 in that order.
It should be noted that all three major constituents of the ISM Services PMI, namely Employment, New Orders and Prices Paid rose notably beyond the previous readings and helped the US Dollar to reverse early-day pullback.
Earlier in the week, the US Factory Orders for July dropped to the lowest since mid-2020 but the details about the orders excluding transport, shipments of goods and inventories were impressive to defend the hawkish Fed bias.
Federal Reserve (Fed) Governor Christopher Waller defended hawkish monetary policy during a CNBC interview and Cleveland Federal Reserve President Loretta Mester ruled out rate cuts. However, Federal Reserve Bank of Boston President Susan Collins cited the risk of an overly restrictive stance on monetary policy to suggest the need for a patient and careful, but deliberate, approach.
Amid these plays, the US Dollar Index (DXY) rose to a fresh high since March 15, after Wednesday’s initial retreat, to close to 105.00 before retreating to 104.85 by the press time. Further, the US 10-year Treasury bond yields rose to a two-week high of around 4.30% and the two-year refreshed weekly top above 5.0%.
Moving on, July trade numbers from Australia and China’s trade data for August will be important to watch for clear directions ahead of the Reserve Bank of Australia (RBA) Governor Philip Lowe’s speech for clear directions. Above all, the risk-off mood and the US Dollar strength appears the key challenge for the AUD/USD buyers.
Despite the latest corrective bounce, AUD/USD remains on the way to testing a six-month-old downward-sloping support line, around 0.6340 by the press time unless witnessing it provides a daily closing beyond the previous support line stretched from August 17, around 0.6415 at he latest.
Technical Levels: Supports and Resistances
AUDUSD currently trading at 0.6381 at the time of writing. Pair opened at 0.6379 and is trading with a change of 0.03% % .
| Overview | Overview.1 | |
|---|---|---|
| 0 | Today last price | 0.6381 |
| 1 | Today Daily Change | 0.0002 |
| 2 | Today Daily Change % | 0.03% |
| 3 | Today daily open | 0.6379 |
The pair remains strongly bearish on the daily time frame. It trades below the 20 SMA @ 0.6451, 50 SMA 0.6596, 100 SMA @ 0.6637 and 200 SMA @ 0.6719.
| Trends | Trends.1 | |
|---|---|---|
| 0 | Daily SMA20 | 0.6451 |
| 1 | Daily SMA50 | 0.6596 |
| 2 | Daily SMA100 | 0.6637 |
| 3 | Daily SMA200 | 0.6719 |
The previous day high was 0.6465 while the previous day low was 0.6358. The daily 38.2% Fib levels comes at 0.6399, expected to provide resistance. Similarly, the daily 61.8% fib level is at 0.6424, expected to provide resistance.
Note the levels of interest below:
- Pivot support is noted at 0.6336, 0.6293, 0.6229
- Pivot resistance is noted at 0.6443, 0.6507, 0.655
| Levels | Levels.1 |
|---|---|
| Previous Daily High | 0.6465 |
| Previous Daily Low | 0.6358 |
| Previous Weekly High | 0.6522 |
| Previous Weekly Low | 0.6401 |
| Previous Monthly High | 0.6724 |
| Previous Monthly Low | 0.6364 |
| Daily Fibonacci 38.2% | 0.6399 |
| Daily Fibonacci 61.8% | 0.6424 |
| Daily Pivot Point S1 | 0.6336 |
| Daily Pivot Point S2 | 0.6293 |
| Daily Pivot Point S3 | 0.6229 |
| Daily Pivot Point R1 | 0.6443 |
| Daily Pivot Point R2 | 0.6507 |
| Daily Pivot Point R3 | 0.6550 |
[/s2If]
Download Nehcap EAWe have two EAs that are operational on our LIVE accounts.
- EA-FIX: Check out the details here. Download EA-FIX . EA-FIX is a non-grid HFT scalper.
- EA-GROWTH: High quality low dd EA using trend grids. Download EA_GROWTHJoin Our Telegram Group
")


