The USDCAD pair is staying unchanged at approximately 1.3595 after the Labor Day holiday in both the US and Canada.
…
This is a premium post.
[s2If !current_user_can(access_s2member_level4)]Please register for FREE REGISTER to read full post below containing analysis. In case of any error or you think you are not able to read the full post below, please email us at support#nehcap.com [lwa][/s2If] [s2If current_user_can(access_s2member_level1)]
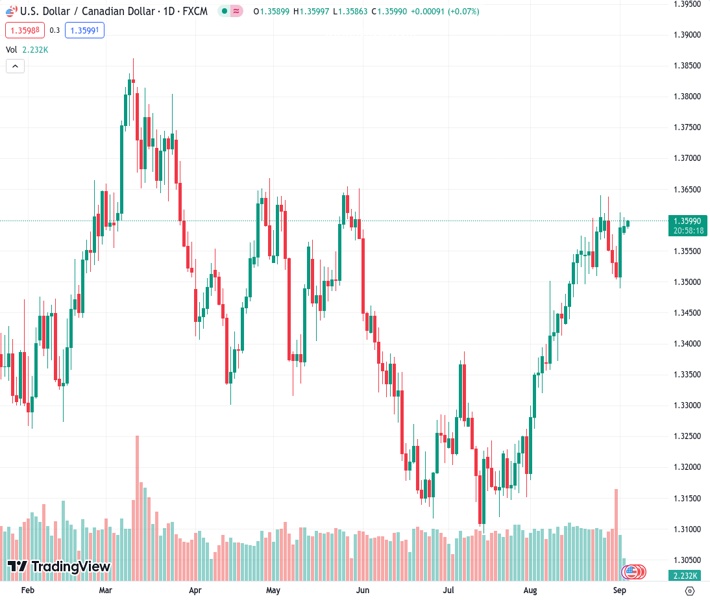
- USD/CAD remains flat around 1.3595 following the US and Canada Labor Day holiday.
The pair currently trades last at 1.35987.
The previous day high was 1.3613 while the previous day low was 1.3489. The daily 38.2% Fib levels comes at 1.3566, expected to provide support. Similarly, the daily 61.8% fib level is at 1.3536, expected to provide support.
The USD/CAD pair consolidates its losses below the 1.3600 mark during the early Asian trading hours on Tuesday. The major pair currently trades near 1.3595, up 0.03% for the day. The pair’s move is limited following the US and Canada Labor Day holiday. Investors await the Bank of Canada (BoC) interest rate decision and markets anticipate an unchanged in policy.
Last week, US economic data displayed mixed results. August’s Nonfarm Payrolls (NFP) came in at 187K, exceeding expectations of 170K and the previous reading of 157K. Nevertheless, the unemployment rate fell substantially to 3.8%, compared to the market consensus and the previous rate of 3.5%. The US Manufacturing PMI came in at 47.6 versus 46.4 previously and exceeded market expectations of 47.0.
Fed Chairman Jerome Powell stated at the Jackson Hole Symposium that a potential additional rate hike would be depending on incoming data. However, Market players bet on a less aggressive Federal Reserve (Fed) stance following the mixed economic data results. The odds of holding an interest rate at the September meeting remain at 93%, according to the CME FedWatch Tool. This, in turn, might cap the upside in the USD and act as a headwind in the USD/CAD pair.
About the data last week, Canadian real Gross Domestic Product (GDP) Annualized for the second quarter contracted at 0.2% YoY against the previous reading of 2.6%. The growth number was worse-than-expected of a 1.2% expansion. The downbeat Canadian data exerted some selling pressure on the Canadian Dollar (CAD).
The markets will shift their attention to the BoC interest rate decision on Wednesday. BoC is expected to maintain its key interest rate unchanged at 5.00% on Wednesday and hold at that level until at least the end of March 2024, according to a Reuters poll. Meanwhile, a rise in oil price lifts the Canadian Dollar against its rivals as Canada is the largest exporter of crude to the US.
Looking ahead, the BoC interest rate decision will be in the spotlight. Later this week, the US ISM Services PMI for August will be released on Wednesday with an expectation to grow to 52.6. On Friday, BoC’s Governor Tiff Macklem’s speech and the Canadian Unemployment rate might offer some hints about the further monetary policy for the entire year and the data could give a clear direction for the USD/CAD pair.
Technical Levels: Supports and Resistances
USDCAD currently trading at 1.3596 at the time of writing. Pair opened at 1.3594 and is trading with a change of 0.01 % .
| Overview | Overview.1 | |
|---|---|---|
| 0 | Today last price | 1.3596 |
| 1 | Today Daily Change | 0.0002 |
| 2 | Today Daily Change % | 0.0100 |
| 3 | Today daily open | 1.3594 |
The pair remains strongly bullish on the daily timeframe. It trades above its 20 SMA @ 1.3514, 50 SMA 1.3346, 100 SMA @ 1.3396 and 200 SMA @ 1.3464.
| Trends | Trends.1 | |
|---|---|---|
| 0 | Daily SMA20 | 1.3514 |
| 1 | Daily SMA50 | 1.3346 |
| 2 | Daily SMA100 | 1.3396 |
| 3 | Daily SMA200 | 1.3464 |
The previous day high was 1.3613 while the previous day low was 1.3489. The daily 38.2% Fib levels comes at 1.3566, expected to provide support. Similarly, the daily 61.8% fib level is at 1.3536, expected to provide support.
Note the levels of interest below:
- Pivot support is noted at 1.3518, 1.3442, 1.3395
- Pivot resistance is noted at 1.3642, 1.3689, 1.3765
| Levels | Levels.1 |
|---|---|
| Previous Daily High | 1.3613 |
| Previous Daily Low | 1.3489 |
| Previous Weekly High | 1.3637 |
| Previous Weekly Low | 1.3489 |
| Previous Monthly High | 1.3640 |
| Previous Monthly Low | 1.3184 |
| Daily Fibonacci 38.2% | 1.3566 |
| Daily Fibonacci 61.8% | 1.3536 |
| Daily Pivot Point S1 | 1.3518 |
| Daily Pivot Point S2 | 1.3442 |
| Daily Pivot Point S3 | 1.3395 |
| Daily Pivot Point R1 | 1.3642 |
| Daily Pivot Point R2 | 1.3689 |
| Daily Pivot Point R3 | 1.3765 |
[/s2If]
Download Nehcap EAWe have two EAs that are operational on our LIVE accounts.
- EA-FIX: Check out the details here. Download EA-FIX . EA-FIX is a non-grid HFT scalper.
- EA-GROWTH: High quality low dd EA using trend grids. Download EA_GROWTHJoin Our Telegram Group
")


