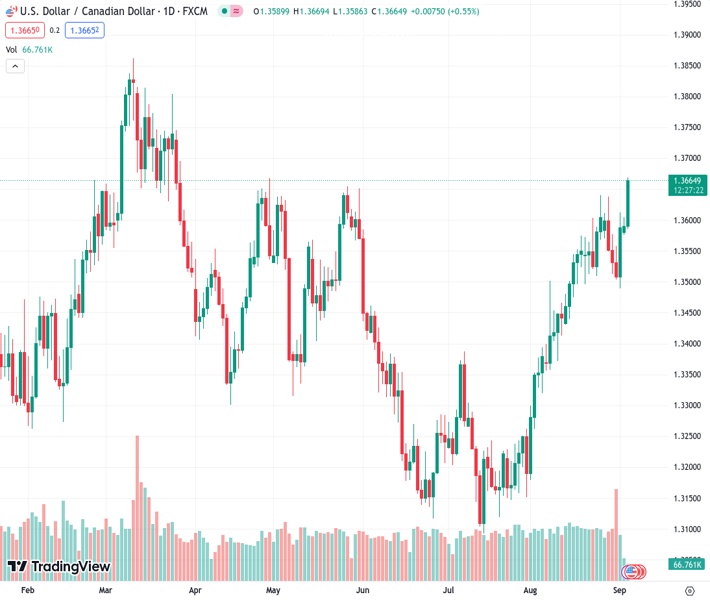
The USDCAD currency pair has surged to its highest level in four months at 1.36690, benefiting from various factors and gaining support.
…
This is a premium post.
[s2If !current_user_can(access_s2member_level4)]Please register for FREE REGISTER to read full post below containing analysis. In case of any error or you think you are not able to read the full post below, please email us at support#nehcap.com [lwa][/s2If] [s2If current_user_can(access_s2member_level1)]
- USD/CAD rallies to over a four-month top and draws support from a combination of factors.
The pair currently trades last at 1.36690.
The previous day high was 1.3605 while the previous day low was 1.3576. The daily 38.2% Fib levels comes at 1.3587, expected to provide support. Similarly, the daily 61.8% fib level is at 1.3593, expected to provide support.
The USD/CAD pair catches aggressive bids following the previous day’s subdued/range-bound price action and jumps to its highest level since April 28 during the early European session on Tuesday. Spot prices currently trade just above mid-1.3600s, up over 0.50% for the day, and seem poised to prolong the recent upward trajectory witnessed over the past month or so.
Crude Oil prices retreat from the YTD peak and undermine the commodity-linked Loonie, which, along with the emergence of fresh US Dollar (USD) buying, provides a goodish lift to the USD/CAD pair. Weaker Chinese data revived concerns that the worsening conditions in the world’s second-largest economy will dent fuel demand. This overshadows expectations that OPEC+ will extend output cuts to the end of the year and weighs on the black liquid.
Meanwhile, China’s slow approach to rolling out more stimulus measures tempers investors’ appetite for riskier assets, which is evident from the prevalent cautious mood around the equity markets. Apart from this, expectations that the Federal Reserve (Fed) will keep interest rates higher for longer, reinforced by a fresh leg up in the US Treasury bond yields, acts as a tailwind for the safe-haven buck and contributes to the USD/CAD pair’s strong move up.
Despite signs that labour market conditions in the US were easing, the markets are still pricing in the possibility of one more 25 bps Fed rate hike move by the end of this year. The bets were lifted following the hotter-than-expected release of inflation data from South Korea, Thailand and the Philippines. This, in turn, pushes the USD Index (DXY), which tracks the Greenback against a basket of currencies, to over a three-month high and favours the USD/CAD bulls.
Even from a technical perspective, acceptance above the 1.3600 mark and a subsequent strength beyond the 1.3635-1.3640 hurdle validate the near-term positive outlook. That said, the Relative Strength Index (RSI) is flashing overbought conditions on hourly charts and warrants some caution before placing fresh bullish bets. Nevertheless, the aforementioned fundamental backdrop suggests that the path of least resistance for the USD/CAD pair is to the upside.
Technical Levels: Supports and Resistances
USDCAD currently trading at 1.3664 at the time of writing. Pair opened at 1.3591 and is trading with a change of 0.54 % .
| Overview | Overview.1 | |
|---|---|---|
| 0 | Today last price | 1.3664 |
| 1 | Today Daily Change | 0.0073 |
| 2 | Today Daily Change % | 0.5400 |
| 3 | Today daily open | 1.3591 |
The pair remains strongly bullish on the daily timeframe. It trades above its 20 SMA @ 1.3525, 50 SMA 1.3355, 100 SMA @ 1.3398 and 200 SMA @ 1.3464.
| Trends | Trends.1 | |
|---|---|---|
| 0 | Daily SMA20 | 1.3525 |
| 1 | Daily SMA50 | 1.3355 |
| 2 | Daily SMA100 | 1.3398 |
| 3 | Daily SMA200 | 1.3464 |
The previous day high was 1.3605 while the previous day low was 1.3576. The daily 38.2% Fib levels comes at 1.3587, expected to provide support. Similarly, the daily 61.8% fib level is at 1.3593, expected to provide support.
Note the levels of interest below:
- Pivot support is noted at 1.3576, 1.3561, 1.3547
- Pivot resistance is noted at 1.3605, 1.362, 1.3634
| Levels | Levels.1 |
|---|---|
| Previous Daily High | 1.3605 |
| Previous Daily Low | 1.3576 |
| Previous Weekly High | 1.3637 |
| Previous Weekly Low | 1.3489 |
| Previous Monthly High | 1.3640 |
| Previous Monthly Low | 1.3184 |
| Daily Fibonacci 38.2% | 1.3587 |
| Daily Fibonacci 61.8% | 1.3593 |
| Daily Pivot Point S1 | 1.3576 |
| Daily Pivot Point S2 | 1.3561 |
| Daily Pivot Point S3 | 1.3547 |
| Daily Pivot Point R1 | 1.3605 |
| Daily Pivot Point R2 | 1.3620 |
| Daily Pivot Point R3 | 1.3634 |
[/s2If]
Download Nehcap EAWe have two EAs that are operational on our LIVE accounts.
- EA-FIX: Check out the details here. Download EA-FIX . EA-FIX is a non-grid HFT scalper.
- EA-GROWTH: High quality low dd EA using trend grids. Download EA_GROWTHJoin Our Telegram Group
")


