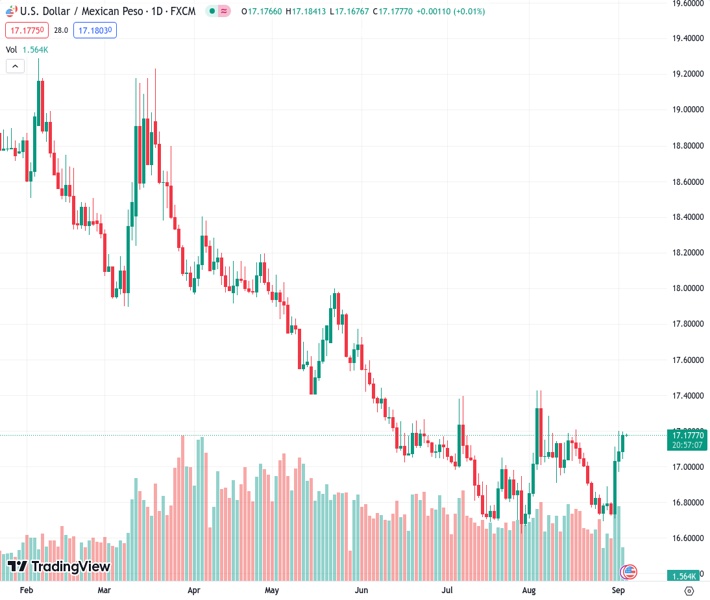
The USD to MXN exchange rate is currently at 17.1784, approaching a declining resistance line that has been in place for 15 weeks. This comes after a three-day period of consecutive gains. However, it is predicted that there will be limited potential for further upward movement.
…
This is a premium post.
[s2If !current_user_can(access_s2member_level4)]Please register for FREE REGISTER to read full post below containing analysis. In case of any error or you think you are not able to read the full post below, please email us at support#nehcap.com [lwa][/s2If] [s2If current_user_can(access_s2member_level1)]
- USD/MXN prods 15-week-old falling resistance line after a three-day-long winning streak.
The pair currently trades last at 17.1784.
The previous day high was 17.2025 while the previous day low was 16.9727. The daily 38.2% Fib levels comes at 17.1147, expected to provide support. Similarly, the daily 61.8% fib level is at 17.0605, expected to provide support.
USD/MXN bulls attack the key upside hurdle surrounding 17.20, close to 17.17 by the press time of early Tuesday morning in Asia.
The Mexican Peso (MXN) pair rose in the last three consecutive days before poking a downward-sloping resistance line from May 31, close to 17.20 at the latest.
The upside momentum takes clues from the bullish MACD signals and the USD/MXN pair’s ability to stay firmer past the 50-DMA, around 16.97 by the press time.
It’s worth noting, however, that a one-month-old horizontal area adds strength to the 17.18–20 hurdle for the USD/MXN bulls.
Following that, a quick run-up towards the ascending resistance line stretched from early July, surrounding 17.46 at the latest, can’t be ruled out.
On the flip side, the USD/MXN pullback remains elusive unless it stays beyond the 50-DMA support of 16.97. That said, the 17.00 round figure restricts the nearby downside of the quote.
In a case where the Mexican Peso (MXN) pair remains bearish past 16.97, a seven-week-long horizontal area surrounding 16.68–70 will be in the spotlight.
Overall, the USD/MXN pair is likely to remain firmer but the immediate resistance line and the presence of the US Factory Orders, as well as Mexican Consumer Confidence, for August test the pair buyers.
Trend: Limited upside expected
Technical Levels: Supports and Resistances
USDMXN currently trading at 17.1754 at the time of writing. Pair opened at 17.0944 and is trading with a change of 0.47% % .
| Overview | Overview.1 | |
|---|---|---|
| 0 | Today last price | 17.1754 |
| 1 | Today Daily Change | 0.0810 |
| 2 | Today Daily Change % | 0.47% |
| 3 | Today daily open | 17.0944 |
The pair is trading above its 20 Daily moving average @ 16.9814, above its 50 Daily moving average @ 16.9721 , below its 100 Daily moving average @ 17.3048 and below its 200 Daily moving average @ 18.0648
| Trends | Trends.1 | |
|---|---|---|
| 0 | Daily SMA20 | 16.9814 |
| 1 | Daily SMA50 | 16.9721 |
| 2 | Daily SMA100 | 17.3048 |
| 3 | Daily SMA200 | 18.0648 |
The previous day high was 17.2025 while the previous day low was 16.9727. The daily 38.2% Fib levels comes at 17.1147, expected to provide support. Similarly, the daily 61.8% fib level is at 17.0605, expected to provide support.
Note the levels of interest below:
- Pivot support is noted at 16.9773, 16.8601, 16.7474
- Pivot resistance is noted at 17.2071, 17.3197, 17.4369
| Levels | Levels.1 |
|---|---|
| Previous Daily High | 17.2025 |
| Previous Daily Low | 16.9727 |
| Previous Weekly High | 17.2025 |
| Previous Weekly Low | 16.6945 |
| Previous Monthly High | 17.4274 |
| Previous Monthly Low | 16.6945 |
| Daily Fibonacci 38.2% | 17.1147 |
| Daily Fibonacci 61.8% | 17.0605 |
| Daily Pivot Point S1 | 16.9773 |
| Daily Pivot Point S2 | 16.8601 |
| Daily Pivot Point S3 | 16.7474 |
| Daily Pivot Point R1 | 17.2071 |
| Daily Pivot Point R2 | 17.3197 |
| Daily Pivot Point R3 | 17.4369 |
[/s2If]
Download Nehcap EAWe have two EAs that are operational on our LIVE accounts.
- EA-FIX: Check out the details here. Download EA-FIX . EA-FIX is a non-grid HFT scalper.
- EA-GROWTH: High quality low dd EA using trend grids. Download EA_GROWTHJoin Our Telegram Group
")


